How to Create an Evidence Table for a Literature Review with AI: Step-by-Step Guide
Linda
Learn how to create an evidence table for a medical literature review with AI. This step-by-step guide covers extraction fields, primary-source verification, endpoint normalization, cross-trial comparison, and a real Noah AI example.
Finding the right papers is only the beginning of a literature review.Once you have selected the studies, the next problem is much more practical: how do you extract information from every paper consistently enough to compare them?One study may emphasize event-free survival. Another may lead with pathological complete response. A third may report safety using a different denominator, follow-up period, or adverse-event definition. If you simply copy the most interesting result from each paper, you can easily end up with a table that looks organized but is methodologically inconsistent.That is what an evidence table is designed to prevent.In this guide, we use a real biomedical case to show how AI can help move from selected papers → standardized extraction fields → structured evidence table → evidence synthesis.We tested the workflow directly with Noah AI, a life-science-focused AI Agent, using randomized clinical evidence on perioperative immunotherapy for resectable non-small cell lung cancer (NSCLC).
Quick Answer
A useful evidence table should not begin with the numbers. First define a standardized extraction schema, then extract the same categories from every included study, preserve differences in endpoint definitions, use NR instead of guessing missing values, and verify every numerical result against the primary source.
What Is an Evidence Table in a Literature Review?
An evidence table is a structured way to extract the same types of information from multiple studies.Depending on the review, it may include:
- study design,
- sample size,
- population characteristics,
- intervention and comparator,
- primary and secondary endpoints,
- efficacy results,
- safety findings,
- follow-up duration,
- limitations,
- and the original citation.
The purpose is not simply to shorten papers.The purpose is to make sure that information from different studies is extracted according to the same rules.
The Real Example Used in This Guide
We used the following research question:In adults with resectable NSCLC, what does randomized clinical evidence show about perioperative immune checkpoint inhibitor therapy combined with chemotherapy compared with chemotherapy-based treatment alone?The core trials included:
- KEYNOTE-671
- AEGEAN
- CheckMate 77T
- Neotorch
This is a useful evidence-table example because the studies address a similar clinical strategy, but they are not identical experiments.They differ in patient populations, stage distribution, immune checkpoint inhibitors, perioperative schedules, pathology assessment, endpoint definitions, analysis populations, follow-up maturity, and safety reporting.
Step 1: Start With a Specific Review Question
Do not start by opening Excel and deciding which columns look useful.Start with the review question.
| Element | Our Example |
|---|---|
| Population | Adults with resectable NSCLC |
| Intervention | Perioperative immune checkpoint inhibitor + chemotherapy |
| Comparator | Chemotherapy-based control |
| Outcomes | EFS, OS, pCR, MPR, surgery, safety |
| Study type | Randomized phase III clinical trials |
Step 2: Give the AI a Structured Extraction Task
We did not simply ask:Make an evidence table about perioperative immunotherapy.Instead, we specified the clinical question, trial set, outcomes, extraction fields, rules for missing data, and cross-trial comparison constraints.In Noah AI, we used Medical & Academia and Deep Research so the task could include biomedical evidence retrieval rather than only text generation.

Step 3: Define the Extraction Schema Before Reading the Results
This is arguably the most important step.If you decide what to extract only after reading each paper, you are likely to capture whatever looks most interesting in that particular study.For example:
- from one paper you may record EFS,
- from another pCR,
- from another safety,
- and from another only the conclusion.
The result is not really an evidence table because the rows are not based on the same extraction logic.Instead, define the schema first.
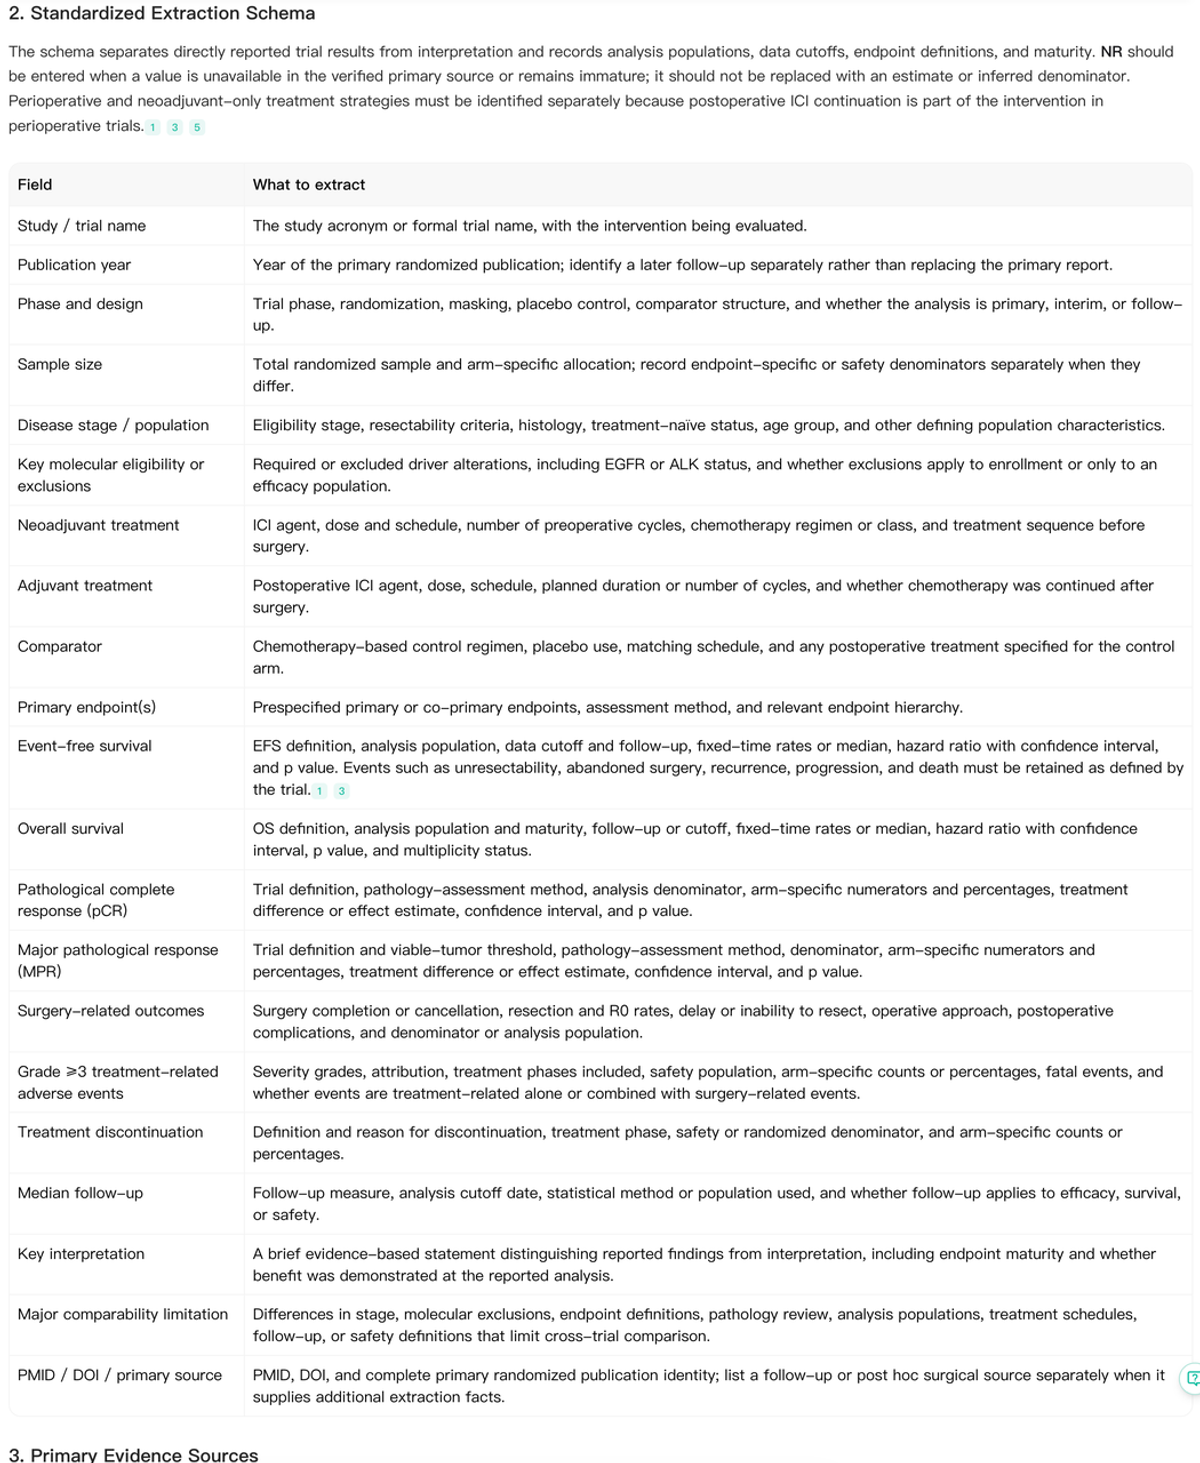
What Should an Evidence Table Extract?
For our clinical-trial example, the full extraction framework included:
| Category | Fields |
|---|---|
| Study identity | Trial name, publication year, phase, design, PMID, DOI |
| Population | Sample size, disease stage, molecular eligibility, treatment-naïve status |
| Treatment | Neoadjuvant treatment, adjuvant treatment, comparator |
| Efficacy | Primary endpoints, EFS, OS, pCR, MPR |
| Implementation | Surgery-related outcomes, discontinuation, follow-up |
| Safety | Grade ≥3 treatment-related adverse events and relevant definitions |
| Interpretation | Key interpretation and major comparability limitation |
Step 4: Separate Study Characteristics From Outcomes
One practical mistake is trying to fit every possible field into one giant table.A better approach is to use at least two layers.
Main Evidence Table
Keep the main table readable. Include only the fields needed to understand the study and its major finding.
Supplementary Extraction Table
Put detailed numbers, safety data, follow-up, and citation metadata into a second table.This prevents the main table from turning into an unreadable spreadsheet with 20 columns.
Step 5: Use Primary Publications for Numerical Extraction
If the original randomized publication is available, do not copy the trial result from a secondary review.A practical evidence hierarchy is:
- Primary randomized publication
- Peer-reviewed updated follow-up
- Regulatory or authoritative trial record
- Conference update, clearly labeled
- Review article, mainly for orientation and citation discovery
Updated publications can be useful for mature OS or EFS results, but they should not silently replace the original report for every other field.
Step 6: Extract the Population Before the Outcome
Before comparing efficacy, first understand who was actually enrolled.Important population fields may include:
- disease stage,
- resectability criteria,
- histology,
- molecular exclusions,
- PD-L1 stratification,
- randomized population,
- modified intention-to-treat population,
- and stage-restricted efficacy cohorts.
This matters because two percentages cannot be interpreted as directly comparable if they come from meaningfully different patient populations.
Step 7: Preserve Endpoint Definitions
Do not make a table cleaner by collapsing different endpoints into one generic category.
| Keep Separate | Why |
|---|---|
| pCR vs MPR | Different pathological thresholds |
| EFS vs DFS | Different event definitions |
| EFS vs PFS | Different clinical settings and event structures |
| TRAEs vs all-cause AEs | Different attribution and safety definitions |
| Interim OS vs mature OS | Different evidence maturity |
Step 8: Use NR Instead of Guessing
A blank cell is often more scientifically honest than a filled cell.If a value is not reported, cannot be verified, or is not yet mature, record:
NR — Not Reported
Do not:
- estimate a missing percentage,
- derive a denominator without confirmation,
- copy a number from a review when the primary paper does not support it,
- treat an interim endpoint as mature,
- or move a number from one analysis population into another.
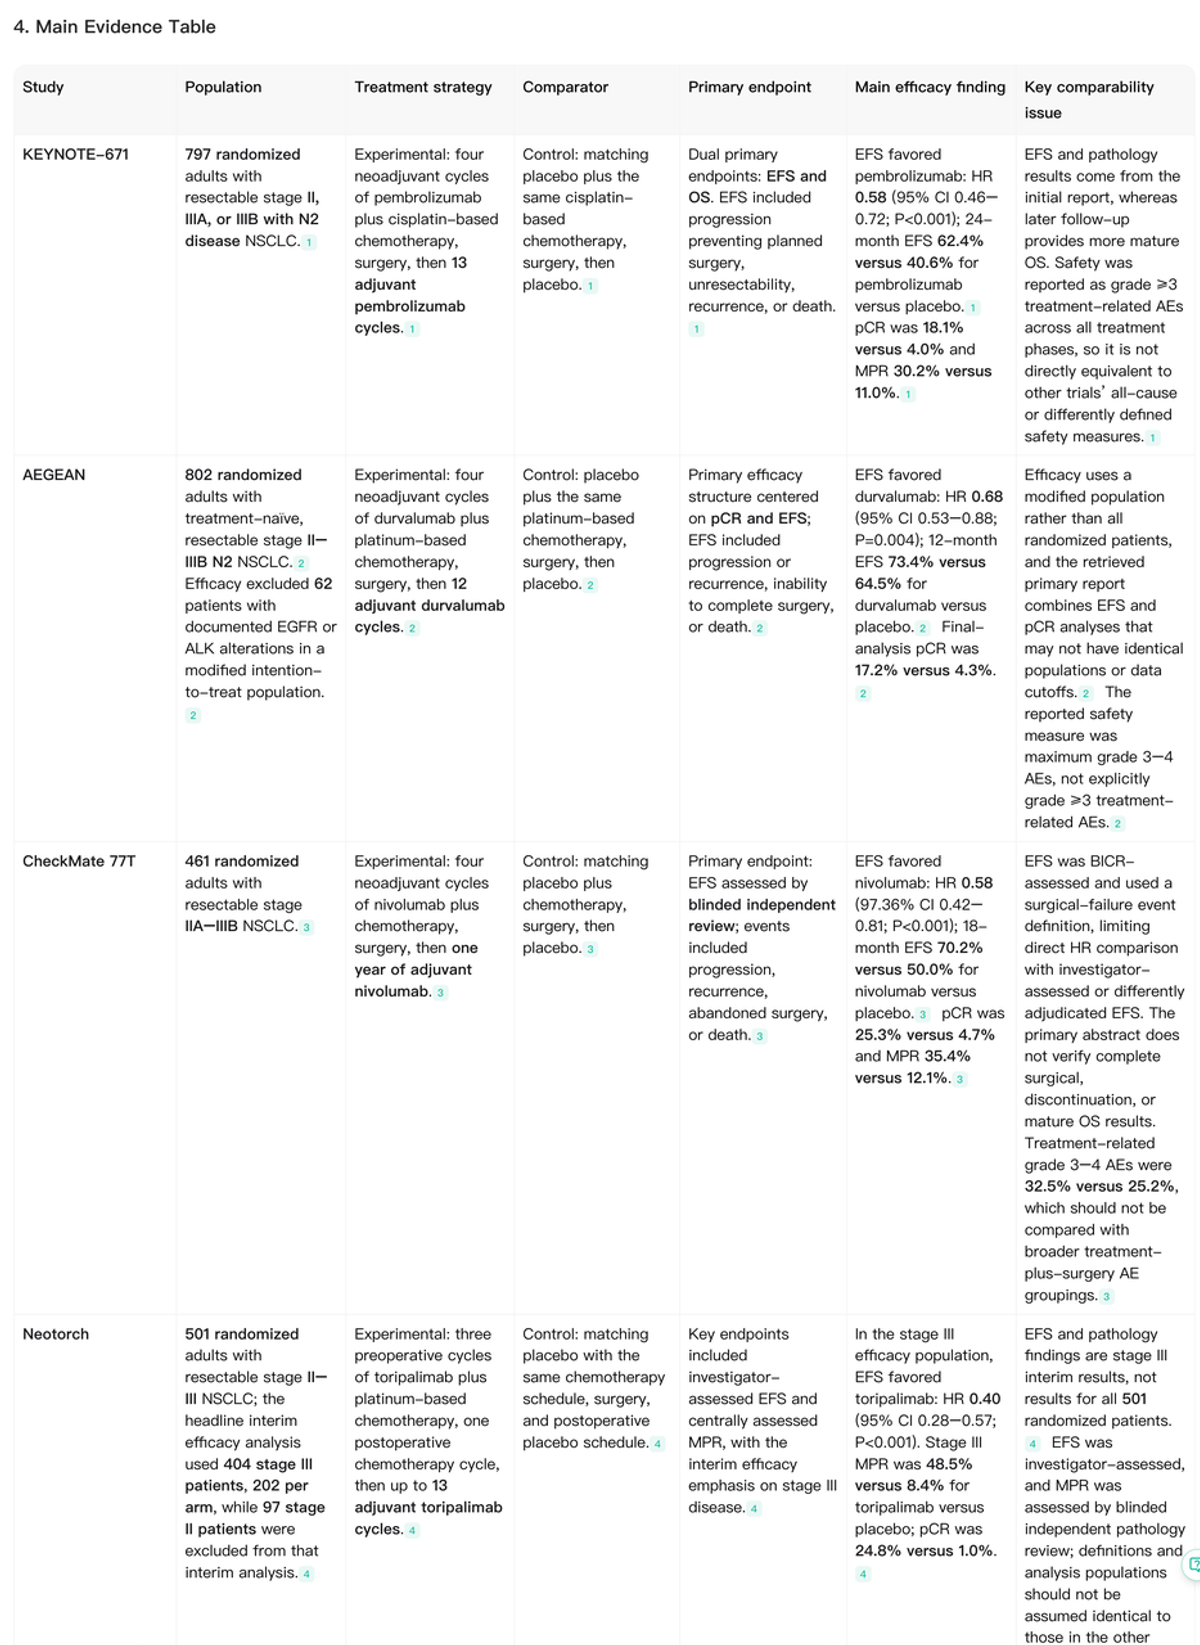
Step 9: Build the Main Evidence Table
Once the extraction framework is stable, the studies can be converted into a concise main evidence table.
Try Noah AI for Free Use Noah AI to search, compare, and analyze biomedical evidence with AI-powered research workflows. Free credits are available, and no credit card is required to get started. Sign Up and Try Noah AI →
Example of a Readable Main Table
| Study | Population | Strategy | Primary endpoint | Main finding | Key limitation |
|---|---|---|---|---|---|
| KEYNOTE-671 | 797 randomized; resectable stage II–IIIB N2 NSCLC | Perioperative pembrolizumab + chemotherapy | EFS and OS | EFS HR 0.58; 24-month EFS 62.4% vs 40.6%; pCR 18.1% vs 4.0% | Efficacy, OS maturity, and safety reporting came from different analyses and definitions. |
| AEGEAN | 802 randomized; stage II–IIIB N2 NSCLC | Perioperative durvalumab + chemotherapy | pCR and EFS | EFS HR 0.68; 12-month EFS 73.4% vs 64.5%; pCR 17.2% vs 4.3% | Efficacy used a modified population excluding documented EGFR/ALK alterations. |
| CheckMate 77T | 461 randomized; stage IIA–IIIB NSCLC | Perioperative nivolumab + chemotherapy | EFS | EFS HR 0.58; 18-month EFS 70.2% vs 50.0%; pCR 25.3% vs 4.7% | EFS was independently reviewed and used a surgical-failure event definition. |
| Neotorch | 501 randomized; stage II–III NSCLC | Perioperative toripalimab + chemotherapy | EFS and MPR | Stage III analysis: EFS HR 0.40; MPR 48.5% vs 8.4%; pCR 24.8% vs 1.0% | Headline efficacy results were from the stage III interim population, not all randomized patients. |
Step 10: Create a Supplementary Extraction Table
The detailed values do not need to live in the main table.A supplementary table can contain:
- exact randomized N,
- pCR,
- MPR,
- EFS,
- OS,
- safety,
- follow-up,
- and primary-source information.
This keeps the main review readable while preserving the full extraction record.
Step 11: Add a Comparability Column
One of the most useful additions to an evidence table is a column explaining why a study should not be directly compared with another study.Without that column, tables can encourage false precision.For example, a pCR rate of 25% in one trial and 18% in another does not prove that the first treatment is superior.Differences may include:
- stage distribution,
- molecular exclusions,
- pathology review,
- treatment duration,
- randomized versus modified efficacy populations,
- endpoint definitions,
- and data maturity.
Step 12: Do Not Rank Trials by Raw Numbers
Evidence tables make numbers easy to compare visually.That convenience can also be dangerous.Incorrect inference: Trial A pCR = 25% Trial B pCR = 18% Therefore Trial A treatment is better.Unless the treatments were compared head-to-head under a common design, this conclusion is not supported.Evidence tables should help expose differences between studies, not erase them.
Step 13: Separate Extracted Facts From Interpretation
Every table should make it clear which fields contain reported study results and which fields contain your interpretation.
Step 14: Verify Every Number Before Writing the Review
AI can reduce extraction time, but the final table should still undergo human verification.
Publication Check
- Is this the correct trial?
- Is this the correct publication?
- Is it the primary paper, follow-up, or subgroup analysis?
Population Check
- Is the randomized N correct?
- Is the efficacy population different from the randomized population?
- Are molecular exclusions applied consistently?
Outcome Check
- Is the endpoint definition correct?
- Is the denominator correct?
- Is the hazard ratio oriented correctly?
- Is the confidence interval correct?
Maturity Check
- Is the analysis interim or final?
- How long is follow-up?
- Is OS mature?
Citation Check
- Verify PMID.
- Verify DOI.
- Prefer primary numerical sources.
Step 15: Turn the Evidence Table Into Synthesis
An evidence table is not the final literature review.The table should make synthesis easier.A weak review often becomes a sequence of paper summaries:KEYNOTE-671 found X. AEGEAN found Y. CheckMate 77T found Z.A stronger synthesis asks:
- What pattern is consistent across studies?
- Where do study designs differ?
- Which findings are mature?
- Which endpoints are not directly comparable?
- What uncertainty remains?
In this example, the broad direction across randomized perioperative NSCLC trials is consistent: adding an immune checkpoint inhibitor to chemotherapy improves major efficacy measures compared with control.But the table also makes it clear why raw pCR percentages, EFS hazard ratios, OS maturity, and safety rates should not simply be ranked across trials.
Step 16: Save Your Extraction Framework for Future Reviews
Once you have built and verified a reliable extraction schema, save it as a reusable framework for future literature reviews.The goal is not to reuse exactly the same columns for every project. Instead, reuse the logic behind the table:
- Study identity: trial name, publication year, study design, and primary source.
- Population: sample size, disease stage, eligibility criteria, and important exclusions.
- Intervention: treatment strategy, schedule, and comparator.
- Endpoints: primary endpoint and major secondary outcomes.
- Results: major efficacy findings, safety findings, and follow-up maturity.
- Interpretation: what the study contributes to the review.
- Comparability: the major reason the study should not be naively compared with another trial.
The exact fields should change with the research question. A treatment-efficacy review may emphasize hazard ratios and response endpoints, while a diagnostic review may need sensitivity, specificity, reference standards, and assay thresholds.Reuse the structure, not necessarily every column.The extraction framework should always be adapted to the specific clinical or scientific question.
A Practical Evidence-Table Workflow
The full workflow can be summarized in twelve steps:
- Define the review question. Specify the population, intervention or exposure, comparator, outcomes, and study type.
- Select the studies that belong in the evidence set. Do not mix contextual papers with core evidence without labeling them.
- Define the extraction fields before reading the results. Decide what information every paper should contribute.
- Verify the primary publication. Separate the original trial report from later follow-up, subgroup, or conference analyses.
- Extract study design and population first. Understand who was studied before comparing what happened.
- Extract endpoints without changing their definitions. Keep pCR, MPR, EFS, DFS, PFS, OS, and different safety definitions separate.
- Use NR for missing or immature data. Do not invent or estimate values to make the table look complete.
- Build a concise main evidence table. Keep only the fields needed to understand the study and its main contribution.
- Move detailed numerical data into a supplementary extraction table. This keeps the main table readable.
- Add limitations and comparability notes. Record why apparently similar studies may not be directly comparable.
- Verify every number and citation. Check endpoint definitions, denominators, data cutoff, PMID, DOI, and publication status.
- Use the table to write synthesis rather than paper-by-paper summaries. Look for patterns, differences, and remaining uncertainty across the evidence base.
Where AI Helps Most
AI can reduce a significant amount of repetitive work in evidence-table development.Useful applications include:
- turning a research question into a preliminary extraction schema,
- retrieving candidate study characteristics from multiple papers,
- standardizing terminology across studies,
- identifying missing or inconsistent fields,
- separating directly reported findings from interpretation,
- flagging population and endpoint differences,
- building a concise main evidence table,
- and identifying fields that require manual verification.
In our Noah AI example, the useful part was not simply producing a table. The workflow first established a standardized extraction framework and then organized heterogeneous randomized trials according to the same structure.That makes the output easier to audit than a free-form summary where each study may be described differently.
What AI Should Not Do
AI-assisted extraction still requires human review.Do not rely on an AI system to:
- invent missing values,
- infer an unreported denominator,
- merge non-equivalent endpoints,
- treat interim findings as mature results,
- move values between different analysis populations,
- rank treatments using uncontrolled cross-trial comparisons,
- assume that two similarly named safety outcomes use the same definition,
- or replace primary-source verification.
AI can accelerate extraction. It should not eliminate source checking.
Frequently Asked Questions
What should be included in an evidence table?
At minimum, an evidence table should usually include study identity, study design, sample size, population, intervention or exposure, comparator where relevant, major endpoints, main results, important limitations, and source information.The exact fields should be determined by the review question rather than copied from a generic template.
How many columns should an evidence table have?
There is no universal number.For readability, a main evidence table often works better with roughly 6–10 important columns. More detailed extraction fields can be moved into a supplementary table.
Can AI create an evidence table automatically?
AI can substantially accelerate extraction, organization, and standardization. However, numerical results, endpoint definitions, denominators, follow-up maturity, and citations should still be checked against the primary source.
What should I do when a paper does not report a value?
Use a clear label such as NR — Not Reported.Do not infer a missing number simply because another publication, review, or later presentation reports a related value.
Should I include review articles in an evidence table?
It depends on the review.For a table comparing primary clinical trials, review articles are better used for orientation, terminology, and reference discovery rather than as the source of trial-level numerical results.
Can I compare clinical trial results directly across rows?
Only with caution.Differences in patient populations, treatment schedules, endpoint definitions, pathology methods, follow-up, statistical maturity, and analysis populations can make direct cross-trial ranking misleading.
Is an evidence table the same as a literature review?
No.The evidence table organizes and standardizes the underlying study information. The literature review then uses that structure to synthesize patterns, inconsistencies, limitations, and remaining evidence gaps.
What is the difference between an evidence table and a data extraction table?
The terms are sometimes used interchangeably, but a data extraction table may contain a much larger set of detailed fields used during review work.An evidence table shown in the final review is often more concise and focuses on the information needed to understand and compare the included studies.
Final Takeaway
A good evidence table is not simply a spreadsheet filled with numbers.It is a standardized extraction framework that preserves what each study actually measured.The most important rule is:Define the table first. Extract second.In our real Noah AI workflow, the process moved from a clinical research question to a standardized extraction schema and then to a structured evidence table comparing randomized perioperative NSCLC trials.Just as importantly, the workflow preserved differences in populations, endpoint definitions, analysis sets, evidence maturity, and safety reporting instead of hiding those differences to make the table look cleaner.That is what makes an evidence table useful for a literature review: it helps researchers see both what the studies collectively show and where direct comparison becomes unreliable.AI can make the extraction process faster, but the final goal is not automation for its own sake. The goal is a more consistent, traceable, and defensible evidence synthesis.Turn Medical Papers Into a Structured Evidence TableUse Noah AI to retrieve biomedical evidence, standardize extraction fields, organize study results, and identify where studies should not be directly compared.Try Noah AI for Free Use Noah AI to search, compare, and analyze biomedical evidence with AI-powered research workflows.
Free credits are available, and no credit card is required to get started.