How to Compare Multiple Research Papers in a Literature Review with AI
Linda
Learn how to compare multiple research papers in a literature review with AI. This step-by-step guide shows how to compare study design, populations, endpoints, results, and write stronger evidence synthesis.
Finding several relevant papers is only the beginning of a literature review.The harder task is deciding how those papers should actually be compared.Two papers may investigate the same disease and report similar endpoints, yet differ in patient population, eligibility criteria, endpoint definitions, follow-up maturity, analysis population, or statistical design.If those differences are ignored, a literature review can easily become a sequence of paper summaries or, worse, an unsupported ranking based on raw percentages.In this guide, we tested Noah AI, a life-science-focused AI agent, using a real biomedical example involving three randomized phase 3 trials: KEYNOTE-671, AEGEAN, and CheckMate 77T.The objective was not to determine which immune checkpoint inhibitor is “best.” Instead, the objective was to learn how to move from three individual papers → structured comparison → interpretation → literature-review synthesis.
Quick Answer
To compare multiple research papers properly, do not begin by comparing effect sizes. First compare study design, patient population, eligibility criteria, endpoint definitions, analysis populations, and follow-up maturity. Then identify where findings agree, where methodology differs, and which apparent differences cannot support direct cross-study ranking. Only after that should you write the synthesis.
The Real Case Used in This Guide
We compared three randomized phase 3 trials evaluating perioperative immune checkpoint inhibitor therapy combined with chemotherapy for resectable non-small cell lung cancer (NSCLC):
- KEYNOTE-671 — perioperative pembrolizumab
- AEGEAN — perioperative durvalumab
- CheckMate 77T — perioperative nivolumab
These papers are suitable for comparative synthesis because they address a closely related clinical strategy in similar disease settings.However, they should not be treated as head-to-head evidence because they differ in stage eligibility, molecular analysis populations, treatment schedules, endpoint construction, analysis populations, and follow-up maturity.
Step 1: Define One Focused Comparison Question
Start with a question that all included papers can meaningfully contribute to.For this example, the question was:Across KEYNOTE-671, AEGEAN, and CheckMate 77T, what do randomized clinical papers collectively show about perioperative immune checkpoint inhibitor therapy for resectable NSCLC, and which methodological differences prevent simple cross-trial comparison?Notice that this is not asking:Which drug has the highest pCR rate?That would immediately push the analysis toward unsupported cross-trial ranking.
Step 2: Make Sure the Papers Are Comparable Enough
Papers do not need to be identical to be compared, but they should answer the same or a closely related question.
| Dimension | What to Check | Why It Matters |
|---|---|---|
| Disease setting | Same disease and treatment stage? | Different clinical settings may have very different baseline risk. |
| Intervention class | Are interventions clinically related? | Completely different therapeutic strategies may not belong in the same comparison. |
| Comparator | Similar control strategy? | Different controls affect treatment-effect interpretation. |
| Outcomes | At least partially overlapping? | Otherwise there may be no common evidence question to synthesize. |
| Study design | RCT, cohort, case-control? | Different designs provide different levels and types of evidence. |
A useful rule is:Comparable enough does not mean identical.
Step 3: Give the AI a Comparison Task, Not a Summary Task
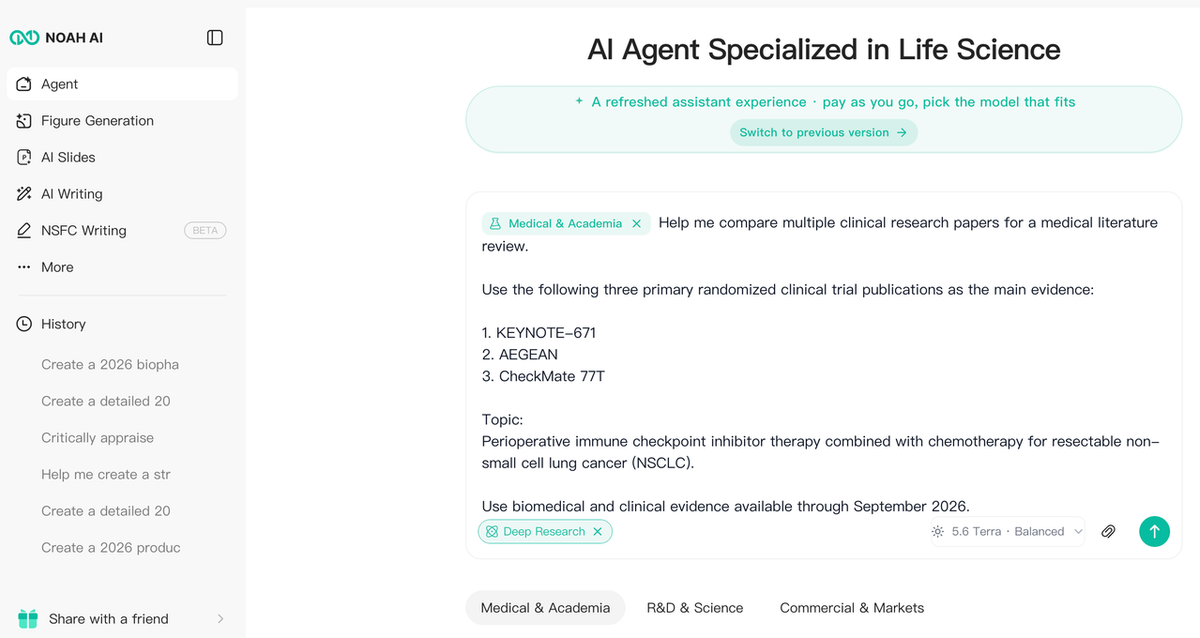
A weak prompt might be:Summarize KEYNOTE-671, AEGEAN, and CheckMate 77T.That would likely create three separate summaries.Instead, we asked Noah AI to compare the papers using a predefined framework covering study design, population, stage, molecular eligibility, perioperative regimen, comparator, endpoints, follow-up, efficacy, pathology outcomes, safety, methodological limitations, and cross-trial comparability.
Step 4: Define the Comparison Dimensions Before Looking at Results
The comparison framework should be decided before looking at which paper has the most favorable number.A useful framework for clinical research papers includes:
| Comparison Layer | Questions to Ask |
|---|---|
| Research question | Are the papers answering the same clinical problem? |
| Study design | Randomization, masking, placebo control, phase, stratification? |
| Population | Who was enrolled and excluded? |
| Intervention | Dose, timing, treatment phases, duration? |
| Comparator | Was the control pathway equivalent? |
| Endpoint definition | Does the same endpoint label mean the same event definition? |
| Analysis population | ITT, mITT, treated population, pathology-evaluable population? |
| Follow-up | Interim or mature analysis? |
| Results | Effect estimate, absolute outcome, CI, time point? |
| Limitations | What prevents direct cross-paper comparison? |
Step 5: Compare Study Design Before Comparing Numbers
Researchers often start with the headline result.A stronger workflow starts with methods.Methods before numbers.Before comparing an EFS hazard ratio of 0.58 with 0.68, first ask whether:
- the endpoint meant the same thing,
- the populations were comparable,
- the analysis denominators were aligned,
- the follow-up periods were similar,
- and the statistical analyses occurred at comparable maturity.
Step 6: Compare the Patient Populations
Population differences are one of the most common reasons why results from different studies should not be mechanically ranked.
| Population Question | Why It Matters |
|---|---|
| Same disease stages? | Stage distribution affects prognosis, surgical feasibility, and expected event rates. |
| Same molecular exclusions? | Molecularly defined subgroups may differ in prognosis and treatment sensitivity. |
| Same performance status? | Patient fitness can influence outcomes and treatment completion. |
| Same analysis population? | ITT and modified ITT populations are not necessarily interchangeable. |
Step 7: Build a Side-by-Side Comparison Matrix
Once the comparison framework is fixed, the three papers can be placed side by side.The purpose of this matrix is not to identify a winner. It is to make methodological differences visible before interpreting efficacy results.
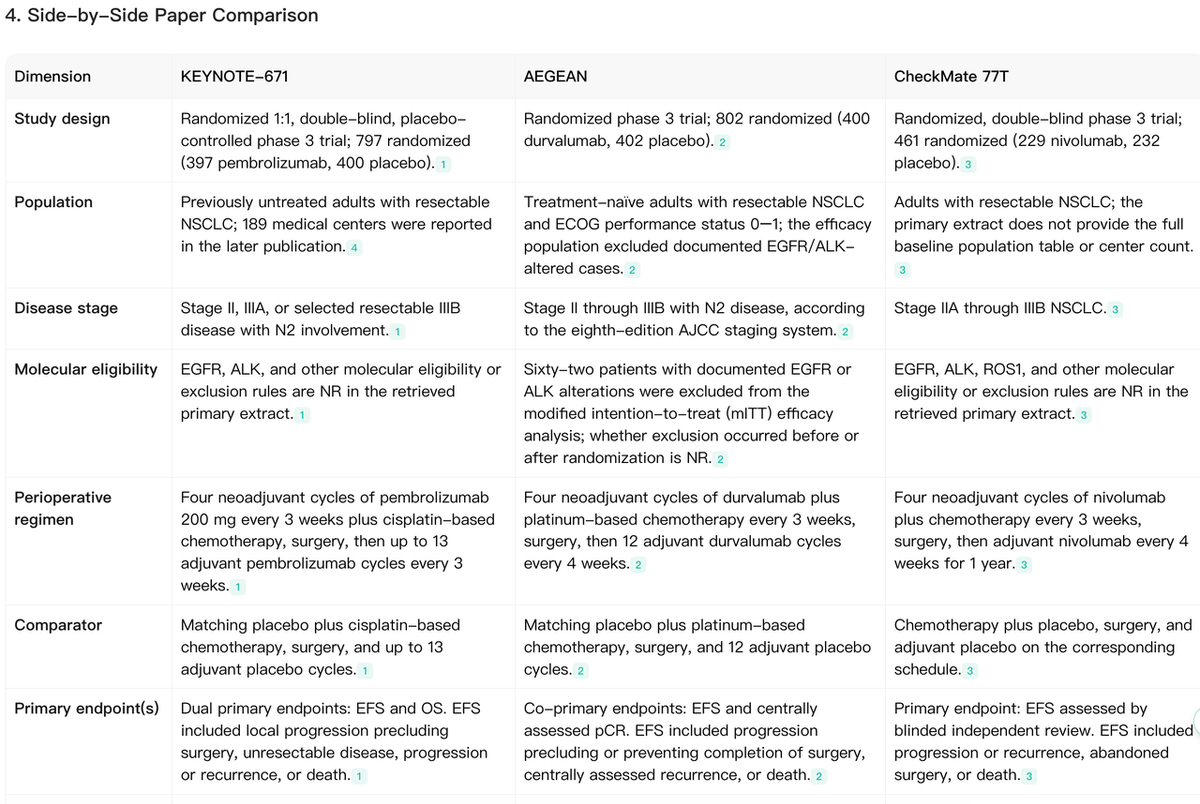
Condensed Comparison
| Dimension | KEYNOTE-671 | AEGEAN | CheckMate 77T |
|---|---|---|---|
| Design | Randomized, double-blind, placebo-controlled phase 3 | Randomized phase 3 | Randomized, double-blind phase 3 |
| Randomized N | 797 | 802 | 461 |
| Stage | Stage II, IIIA, selected IIIB N2 | Stage II–IIIB with N2 disease | Stage IIA–IIIB |
| Neoadjuvant strategy | Pembrolizumab + chemotherapy | Durvalumab + chemotherapy | Nivolumab + chemotherapy |
| Postoperative strategy | Up to 13 pembrolizumab cycles | 12 durvalumab cycles | Nivolumab every 4 weeks for 1 year |
| Primary endpoint | EFS + OS | EFS + pCR | EFS |
| Analysis population | ITT | mITT excluding documented EGFR/ALK-altered cases | 461 randomized; full primary efficacy denominator not fully verified in retrieved extract |
Step 8: Compare Endpoint Definitions Before Effect Sizes
A common mistake is assuming that two studies reporting the same endpoint name have measured exactly the same thing.Even EFS may use different event definitions.
| Trial | Important EFS Components |
|---|---|
| KEYNOTE-671 | Local progression precluding planned surgery, unresectable disease, progression or recurrence, or death. |
| AEGEAN | Progression preventing or precluding completion of surgery, recurrence, or death. |
| CheckMate 77T | Progression or recurrence, abandoned surgery, or death. |
These definitions are related, but not perfectly identical.Compare what was measured before comparing how large the result was.
Step 9: Identify Where the Papers Agree
Comparative synthesis should not focus only on differences. First identify whether the evidence points in a consistent direction.
| Shared Finding | Cross-Paper Interpretation |
|---|---|
| Favorable EFS direction | Each randomized trial reported an EFS hazard ratio below 1 for the perioperative ICI strategy versus control. |
| Higher pCR | All three trials reported higher pCR proportions in the ICI-containing arm versus the corresponding control arm. |
| Perioperative feasibility | Available trial-specific evidence supports feasibility of the perioperative treatment pathway, although reporting is not harmonized across studies. |
| Treatment burden matters | Severe adverse-event reporting indicates that efficacy should not be interpreted without considering treatment burden, although safety definitions differ across trials. |
The strongest synthesis is therefore directional:Across three randomized trials, perioperative ICI plus chemotherapy consistently favored the experimental arm for EFS and pathological response relative to each trial's own control.That statement is substantially stronger than saying:Nivolumab had the highest pCR, therefore it was best.
Step 10: Identify Where the Papers Differ
Differences should be organized into methodological categories rather than treated as random inconsistencies.
| Difference | Why It Matters |
|---|---|
| Disease stage | Baseline prognosis, nodal burden, resectability, and event risk may differ. |
| Molecular exclusions | AEGEAN's efficacy population excluded documented EGFR/ALK-altered cases, while comparable handling was not fully verified for the other retrieved extracts. |
| EFS definition | Surgery-related events and progression wording are not identical. |
| Analysis population | ITT and mITT estimates should not automatically be treated as equivalent. |
| Follow-up maturity | A mature five-year OS analysis cannot be directly aligned with an interim or unavailable mature OS analysis. |
| Safety definitions | Grade 3–5 treatment-related AEs and maximum grade 3/4 AEs are not the same safety construct. |
Step 11: Decide Which Numbers Should Not Be Directly Compared
This is one of the most important steps in multi-paper comparison.Similar-looking numbers can create the illusion of comparability.
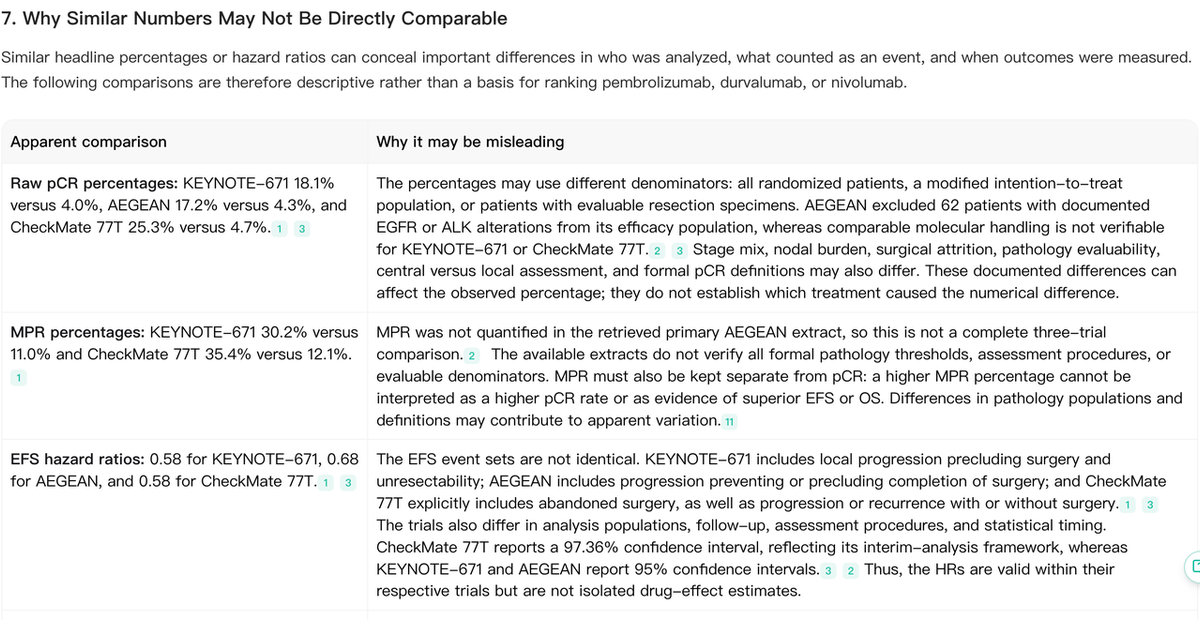
Insert the screenshot comparing pCR, MPR, and EFS hazard ratios
Example: pCR
Looking only at these percentages could tempt a reader to rank the treatments.But several factors may differ:
- stage distribution,
- molecular exclusions,
- analysis population,
- pathology-evaluable denominator,
- central versus local pathology assessment,
- surgical attrition,
- and formal response definitions.
The percentages therefore describe outcomes within each trial. They do not provide a randomized comparison between pembrolizumab, durvalumab, and nivolumab.
Example: EFS Hazard Ratios
| Trial | EFS HR | Why Caution Is Needed |
|---|---|---|
| KEYNOTE-671 | 0.58 | Trial-specific endpoint definition and analysis timing |
| AEGEAN | 0.68 | Different mITT efficacy population and endpoint framework |
| CheckMate 77T | 0.58 | Different EFS event wording and interim-analysis framework |
A hazard ratio is a treatment effect estimate within that trial. It is not an isolated property of the drug.
Step 12: Explain Apparent Disagreement
When papers report different numerical results, do not immediately call them contradictory.First ask whether the difference could arise from methodology.
| Possible Source | Question to Ask |
|---|---|
| Population | Were different disease stages or risk profiles enrolled? |
| Eligibility | Were molecular subgroups included or excluded differently? |
| Treatment schedule | Was perioperative exposure or duration different? |
| Endpoint definition | Did “EFS” or “pCR” mean exactly the same thing? |
| Analysis population | ITT or mITT? |
| Follow-up | Were results reported at similar maturity? |
| Statistics | Were interim boundaries or confidence levels different? |
Importantly, a plausible methodological explanation is not the same as a demonstrated causal explanation.Separate documented differences from plausible interpretation.
Step 13: Separate Agreement, Difference, and Uncertainty
A strong synthesis should explicitly distinguish these three categories.AgreementAll three trials support a favorable within-trial EFS direction and improved pCR with perioperative ICI.DifferencePopulations, molecular exclusions, endpoint definitions, analysis populations, safety reporting, and follow-up are not fully aligned.UncertaintyNo head-to-head randomized comparison establishes which perioperative regimen is superior.
Step 14: Write Synthesis Instead of Three Mini-Summaries
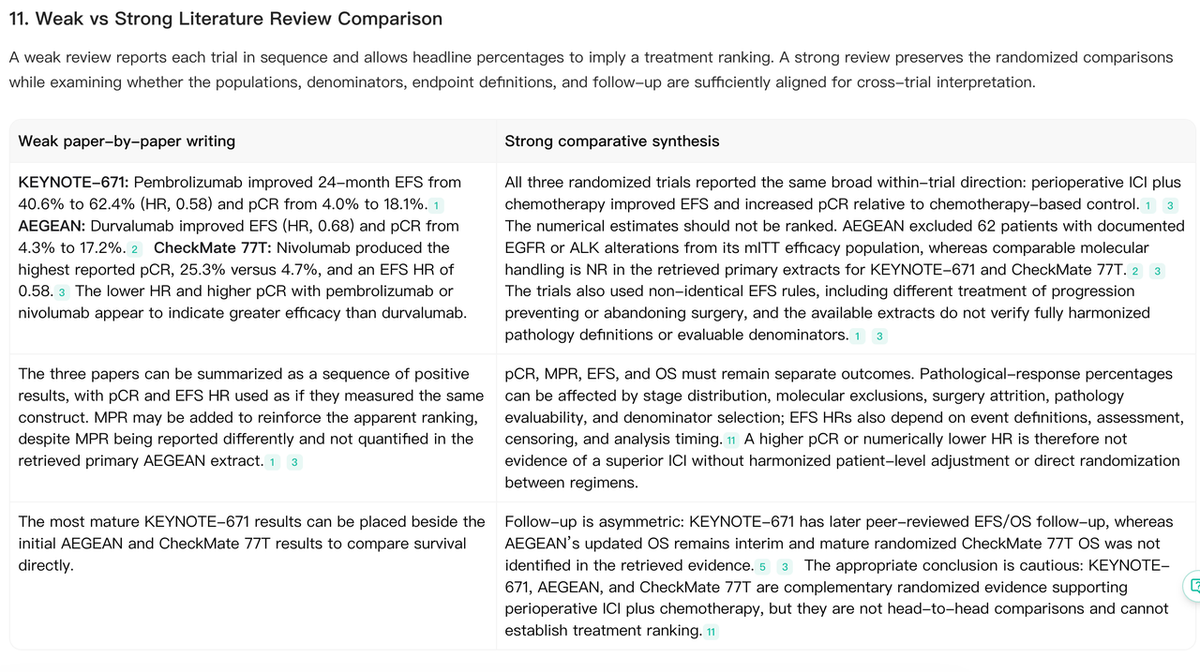
This is where many literature reviews fail.Weak writing often looks like this:KEYNOTE-671 found X. AEGEAN found Y. CheckMate 77T found Z.That is paper-by-paper reporting.Strong synthesis instead organizes the evidence around the question:Across the three randomized trials, perioperative checkpoint inhibition combined with chemotherapy consistently improved major efficacy measures relative to each study's chemotherapy-based control. However, differences in disease stage, molecular exclusions, endpoint definitions, analysis populations, and follow-up maturity prevent direct numerical ranking across trials.
Try Noah AI for Free Use Noah AI to search, compare, and analyze biomedical evidence with AI-powered research workflows.
Free credits are available, and no credit card is required to get started. Sign Up and Try Noah AI →
Step 15: Use a Comparison Hierarchy
One useful way to avoid premature numerical comparison is to work through the papers in layers.
| Level | Question |
|---|---|
| 1. Design | How was the study conducted? |
| 2. Population | Who was studied? |
| 3. Measurement | What exactly was measured? |
| 4. Results | What did the study find? |
| 5. Interpretation | Why might findings agree or differ? |
| 6. Synthesis | What do the papers collectively support? |
Step 16: Verify the Primary Sources
AI can accelerate comparison, but every major numerical and methodological claim should still be verified against the relevant publication.Before finalizing a literature review, check:
- primary publication versus later follow-up,
- randomized sample size,
- eligible disease stage,
- molecular exclusions,
- intervention schedule,
- comparator,
- endpoint definition,
- analysis population,
- follow-up and data cutoff,
- effect estimate and confidence interval,
- safety definition,
- and whether a statement accidentally implies unsupported cross-trial superiority.
A Reusable Multi-Paper Comparison Workflow
- Define one focused review question.
- Select papers addressing the same or closely related question.
- Define comparison dimensions before looking at outcomes.
- Compare study design and population first.
- Compare endpoint definitions before effect sizes.
- Identify findings that agree across studies.
- Identify important methodological differences.
- Explain apparent disagreement cautiously.
- Separate direct evidence from interpretation.
- Identify which numerical comparisons are not justified.
- Write synthesis across papers rather than one summary per paper.
- Verify every important claim against the primary source.
What AI Should Not Do
AI should not be used to:
- rank treatments solely from raw cross-trial percentages,
- assume identical endpoint definitions,
- merge ITT and mITT populations without qualification,
- fill missing methodological details by inference,
- treat interim and mature analyses as equivalent,
- convert plausible explanations into proven causal explanations,
- or replace verification of primary papers.
Useful Tools for Multi-Paper Literature Review Comparison
| Tool | Best Role |
|---|---|
| Noah AI | Biomedical multi-paper comparison, methodological alignment, evidence synthesis, and source-linked research analysis. |
| Elicit | Structured extraction and comparison across multiple papers. |
| SciSpace | Reading and comparing full-text methods and results. |
| Scite | Citation context and how later literature discusses individual claims. |
| PubMed | Verifying primary biomedical publications and follow-up reports. |
| Zotero | Organizing the final literature set and references. |
| Excel / Google Sheets | Manual comparison matrices and final quality control. |
We tested Noah AI directly in the workflow shown in this guide. Other tools are described according to their documented research workflows and typical use cases.
Common Mistakes When Comparing Research Papers
Mistake 1: Comparing numbers before methods
A lower hazard ratio or higher response percentage does not automatically mean a better treatment when the studies were designed differently.
Mistake 2: Treating the same endpoint label as the same endpoint
Check event definitions, assessment rules, censoring, denominators, and analysis populations.
Mistake 3: Writing one paragraph per paper
Literature review synthesis should organize evidence around the research question, not around the order in which papers were read.
Mistake 4: Treating missing information as equivalent
If a methodological detail cannot be verified, label it as unavailable rather than assuming it matches another trial.
Mistake 5: Ignoring follow-up maturity
Mature five-year survival data and an interim survival analysis are not equivalent evidence stages.
Mistake 6: Turning indirect comparison into a treatment ranking
Cross-trial differences can generate hypotheses, but direct claims of superiority require much stronger comparative evidence.
Frequently Asked Questions
How do you compare multiple papers in a literature review?
Define one review question, choose comparable papers, establish common comparison dimensions, compare methods and populations first, align endpoint definitions, identify areas of agreement and difference, and then write a synthesis across papers.
Should I compare study results directly?
Only after checking whether populations, endpoint definitions, analysis populations, follow-up, and statistical frameworks are sufficiently aligned.
Can I compare hazard ratios from different clinical trials?
Hazard ratios can be presented descriptively, but they should not automatically be interpreted as head-to-head estimates of one treatment versus another.
What is the difference between an evidence table and comparative synthesis?
An evidence table standardizes study-level information. Comparative synthesis goes one step further by asking what the papers collectively support, where they differ, why those differences matter, and what uncertainty remains.
Can AI compare multiple research papers?
AI can help organize papers under common dimensions, identify methodological differences, compare reported evidence, and draft synthesis. Important numerical and methodological claims should still be verified against the primary sources.
How many papers should I compare at once?
There is no fixed number. For a focused manual or AI-assisted workflow, starting with three to five highly relevant papers often makes methodological differences easier to inspect before scaling to a larger literature set.
What should I do if two papers disagree?
First determine whether the disagreement is truly biological or clinical, or whether it may reflect differences in patient population, measurement, endpoint definition, treatment schedule, follow-up, analysis population, or statistical design.
Final Takeaway
Comparing multiple research papers is not mainly about putting numbers next to each other.The real task is to understand whether those numbers were generated under sufficiently similar conditions to support comparison.Compare study design, populations, and endpoint definitions before comparing effect sizes.In the KEYNOTE-671, AEGEAN, and CheckMate 77T example, all three randomized programs support a consistent within-trial direction for perioperative immune checkpoint inhibition combined with chemotherapy.But differences in stage eligibility, molecular handling, analysis populations, endpoint definitions, pathology reporting, safety definitions, and follow-up maturity mean that the reported percentages and hazard ratios should not be treated as direct drug-to-drug comparisons.That is the difference between simply summarizing several papers and actually synthesizing them.AI can accelerate that process by making the comparison framework explicit, surfacing methodological differences, and helping researchers move from paper-by-paper reporting → comparative reasoning → evidence synthesis.
Try Noah AI for Free Use Noah AI to search, compare, and analyze biomedical evidence with AI-powered research workflows.
Free credits are available, and no credit card is required to get started.