How to Create Effective Scientific Figures for Research Publications with Noah AI
Linda
Learn how to create effective scientific figures for research publications, from figure planning and layout to AI-assisted drafting with Noah AI.
Scientific figures are essential for explaining complex research clearly. Whether you are preparing a journal article, conference poster, grant proposal, graphical abstract, or medical research report, strong visuals help readers understand your research question, mechanism, workflow, and findings faster. Yet many researchers are trained to design experiments, not figures. As a result, creating effective figures for scientific publications can feel time-consuming and frustrating.
This guide explains how to plan, design, and refine scientific figures for research publications. It covers common figure types, best practices, traditional tools such as Adobe Illustrator, PowerPoint, and BioRender, and the role of an AI scientific figure maker in early planning and drafting. It also explains how Noah AI can support researchers by helping turn medical and life science content into clearer figure concepts. AI can speed up the first draft, but scientific accuracy, source traceability, and researcher review remain essential before any figure is used in a paper, poster, or presentation.
Introduction
Scientific figures are not decoration. They are part of the scientific argument. A well-designed figure can help readers understand a disease mechanism, signaling pathway, experimental workflow, clinical study design, comparison between treatment strategies, or visual summary of research findings.
For PhD students, medical researchers, biotech professionals, and academic authors, figures often determine how quickly others can understand the value of the work. Scientific figures for papers, posters, presentations, and research reports should make complex information easier to read, not harder.
The challenge is that many researchers are not trained designers. They may understand the biology, clinical context, or experimental design very well, but struggle to translate that knowledge into a clean visual structure.
This is why scientific figure generation should start with planning. Before opening Adobe Illustrator, PowerPoint, BioRender, or an AI scientific figure generator, researchers should define the figure’s message, audience, structure, and scientific content.
What Makes an Effective Scientific Figure?
An effective scientific figure communicates one clear idea. Before you design, ask: what should the reader understand after looking at this figure for ten seconds?
Strong research figures usually have the following qualities:
- Clear research message: every figure should have a purpose, such as explaining a mechanism, summarizing a workflow, comparing groups, or highlighting a key finding.
- Logical structure: the layout should guide the reader naturally, often left to right, top to bottom, or from cause to effect.
- Accurate labels: terms, pathways, cell types, drugs, endpoints, and study phases should be scientifically appropriate.
- Readable text: labels should remain readable in the final format, whether it is a paper, slide, or poster.
- Consistent visual hierarchy: important elements should stand out, while secondary details should not compete with the main message.
- Appropriate level of detail: the figure should simplify the research message while preserving accuracy.
- Scientific accuracy: mechanisms, pathways, arrows, labels, study steps, and relationships should be reviewed by the researcher before submission.
- Format alignment: the figure should match journal, poster, presentation, or report requirements.
Common Types of Scientific Figures
Different research questions require different figure formats. Choosing the right format is the first step toward creating effective figures for scientific publications.
| Figure Type | Purpose | Common Use Cases |
|---|---|---|
| Mechanism diagram | Explains how a biological, pharmacological, or disease process works | Drug mechanism of action, immune response, metabolic regulation |
| Pathway diagram | Shows signaling, molecular, or cellular pathways | Oncology pathways, inflammatory signaling, receptor activation |
| Experimental workflow figure | Shows the sequence of experimental steps | Biomarker validation, sequencing workflow, cell assay pipeline |
| Graphical abstract | Summarizes the main message of a paper visually | Journal submissions, article summaries, research promotion |
| Clinical study design figure | Explains trial structure, cohorts, timelines, and endpoints | Phase 1/2/3 trial summaries, clinical research reports |
| Visual comparison table | Compares methods, drugs, biomarkers, or study groups | Review articles, research reports, grant proposals |
| Medical illustration | Represents anatomy, disease processes, cells, tissues, or interventions | Medical education, clinical reports, life science presentations |
A mechanism diagram may work well when explaining a drug’s biological effect. An experimental workflow figure is better for showing how samples move from collection to analysis. A graphical abstract is useful when the goal is to summarize the entire paper in one visual.
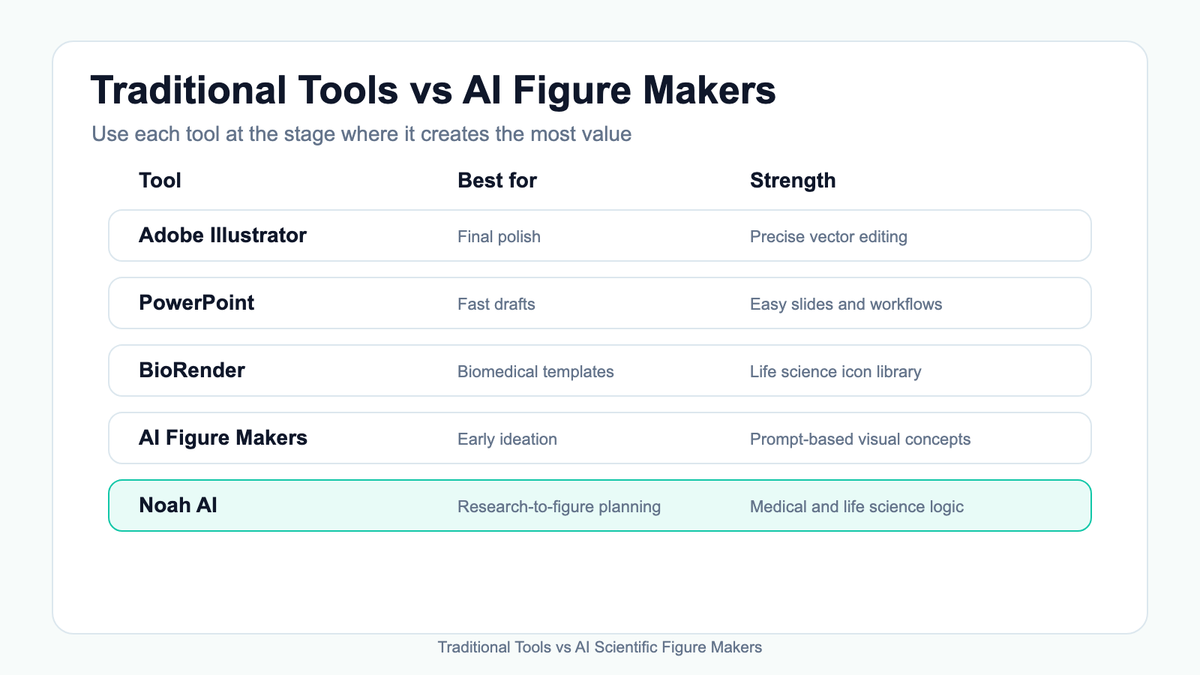
Traditional Tools vs AI Scientific Figure Makers
Researchers have several options when they need to make scientific figures. Traditional tools remain valuable, especially for final polishing. AI tools are increasingly useful for planning, drafting, and exploring figure concepts.
| Tool | Best For | Strengths | Limitations |
|---|---|---|---|
| Adobe Illustrator for scientific figures | Final polishing and precise visual control | Highly flexible, professional design control, strong for publication-ready editing | Steep learning curve, time-consuming, requires design skill |
| PowerPoint | Quick layouts, posters, presentations, simple workflow figures | Easy to use, familiar, good for early drafts and slides | Limited precision, can look inconsistent without careful formatting |
| BioRender | Biology and medical figure templates | Fast, template-based, designed for life science visuals | May require subscription, template style may feel similar across figures |
| AI scientific figure makers | Early ideation, prompt-based drafts, figure planning | Helps structure ideas quickly and convert text into visual concepts | Requires human review and may need final editing in traditional tools |
| Noah AI | AI-assisted figure planning for medical and life science research | Helps translate research content into figure ideas, mechanisms, workflows, and visual summaries | Requires researcher review; final polishing may still need traditional tools |
Adobe Illustrator scientific figures are often useful when the researcher needs detailed control over layout, icons, labels, and publication formatting. PowerPoint is useful for fast drafts and presentations. BioRender helps researchers create biomedical visuals with templates.
An AI scientific figure maker can support a different part of the workflow: early concept development. Instead of starting from a blank canvas, researchers can describe the mechanism, workflow, or study design and use AI to generate an initial structure.
The best approach is often hybrid:
- Plan the figure concept.
- Use AI to draft or structure the idea.
- Review the scientific content.
- Refine the figure in a traditional design tool if needed.
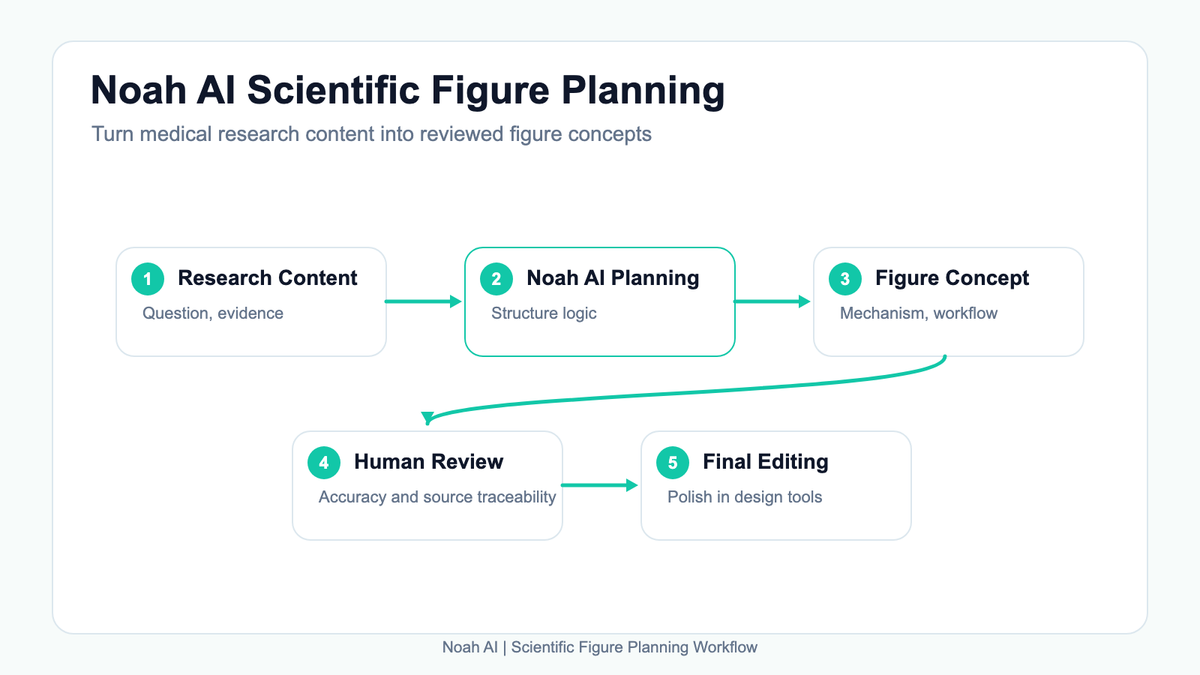
How Noah AI Can Support Scientific Figure Creation
Noah AI can support scientific figure creation by helping researchers turn complex medical and life science content into clearer visual concepts.
It should not be treated as a replacement for scientific review or final publication editing. Instead, it can act as an AI research assistant and AI scientific figure maker during the planning and drafting stages.
Researchers can use Noah AI to:
- Turn a research question into a figure concept
- Organize a mechanism diagram
- Structure an experimental workflow figure
- Draft a graphical abstract idea
- Summarize a medical research report into visual sections
- Compare multiple mechanisms of action
- Prepare figure ideas for papers, posters, and presentations
- Ask follow-up questions about figure clarity and missing elements
For example, a researcher preparing a review article may use Noah AI to identify the key steps in a disease mechanism and then generate a draft structure for a mechanism diagram. A PhD student preparing a poster may use it to convert a complex methods section into an experimental workflow figure.
Researchers working in biopharma or medical research can also explore the Noah AI tutorial for biopharma and medical research to learn how Noah supports biomedical research workflows beyond scientific figure creation.
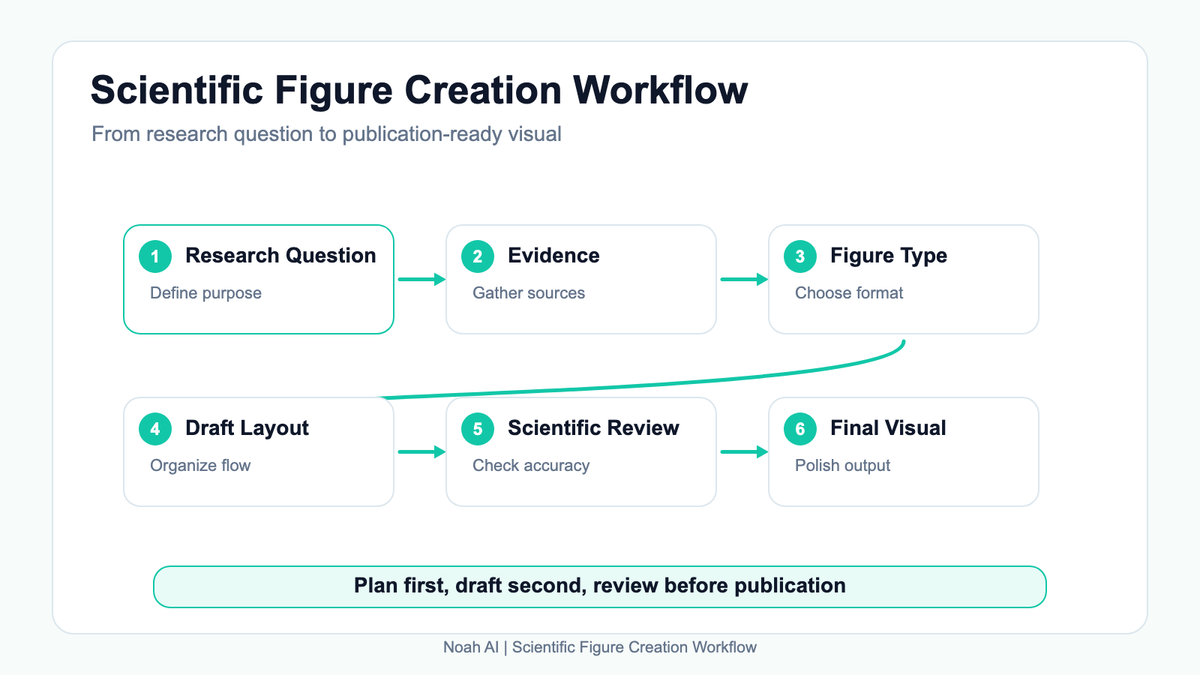
Step-by-Step Workflow for Creating Scientific Figures
Step 1: Define the Purpose of the Figure
Start by writing one sentence that explains the figure’s goal.
Examples:
- This figure explains how a drug regulates inflammatory signaling.
- This figure summarizes the experimental workflow for biomarker validation.
- This figure compares three treatment mechanisms in the same disease area.
If the purpose is unclear, the figure will likely become cluttered.
Step 2: Choose the Figure Type
Match the figure type to the communication goal. Use a mechanism diagram if you need to explain cause and effect. Use an experimental workflow figure if you need to show process steps. Use a graphical abstract if you need to summarize the main message of a paper.
Step 3: List the Scientific Elements
Before designing, list the required content:
- Molecules, cells, tissues, or organs
- Study groups or cohorts
- Experimental steps
- Timepoints
- Inputs and outputs
- Key outcomes
- Labels and abbreviations
- Citation or source notes, if needed
This helps prevent missing important information.
Step 4: Write a Clear Prompt for AI Drafting
If using an AI scientific figure generator or AI scientific figure maker, the prompt should be specific.
Include:
- Topic
- Figure type
- Main components
- Direction of flow
- Intended audience
- Desired level of detail
- Terms that must appear as labels
A weak prompt is:
“Make a cancer figure.”
A stronger prompt is:
“Create a mechanism diagram showing how immune checkpoint inhibitors enhance T-cell mediated anti-tumor response. Include tumor cells, T cells, PD-1/PD-L1 interaction, checkpoint blockade, and increased immune activation. Use a clean layout suitable for a research presentation.”
Step 5: Generate a Draft with Noah AI
Noah AI can help create a first visual concept based on your research content. The goal is not to produce a final figure immediately. The goal is to move from a blank page to a structured draft.
At this stage, researchers can ask:
- Is the figure message clear?
- Are important steps missing?
- Is the flow logical?
- Are labels understandable?
- Does the visual match the research question?
Step 6: Review Scientific Accuracy
Human review is essential.
Check:
- Are mechanisms represented correctly?
- Are arrows scientifically accurate?
- Are labels precise?
- Are claims supported by evidence?
- Are abbreviations defined?
- Are any relationships oversimplified?
For medical and life science content, source traceability matters. If the figure is based on published evidence, make sure the underlying references are reviewed.
Researchers working with evidence-intensive scientific content can also explore How to Use Noah for Medical Literature Review to learn how to find, organize, and verify biomedical evidence before turning research findings into scientific figures.
Step 7: Edit Layout, Labels, and Visual Hierarchy
After reviewing accuracy, refine the design.
Improve:
- Alignment
- Spacing
- Label length
- Font size
- Grouping
- Arrow direction
- Color consistency
- Visual emphasis
Traditional tools such as Adobe Illustrator, PowerPoint, or BioRender may still be useful for final formatting and journal-specific requirements.
Step 8: Adapt the Figure for the Final Format
A figure for a paper may need different formatting from a figure for a presentation.
Check:
- Journal size requirements
- Resolution
- File type
- Font readability
- Color accessibility
- Caption alignment
- Permission and licensing requirements
- Whether the figure still works in grayscale
Example Prompts for Scientific Figure Generation
Here are example prompts researchers can adapt.
Mechanism Diagram Prompt
“Create a mechanism diagram showing how GLP-1 receptor agonists regulate appetite and glucose metabolism. Include the brain, pancreas, liver, gastrointestinal tract, insulin secretion, glucagon reduction, delayed gastric emptying, and appetite signaling. Use a clean layout for a medical research presentation.”
Experimental Workflow Figure Prompt
“Generate an experimental workflow figure for biomarker validation in oncology. Include patient sample collection, sequencing, biomarker detection, data analysis, clinical correlation, and validation cohort. Use a left-to-right workflow layout.”
Graphical Abstract Prompt
“Create a graphical abstract for a paper about immune checkpoint inhibitors. Show tumor cells, T cells, PD-1/PD-L1 interaction, checkpoint blockade, immune activation, and tumor response. Keep the visual simple and suitable for a journal article summary.”
Clinical Study Design Prompt
“Design a clinical study workflow figure for a Phase 2 trial. Include screening, enrollment, randomization, treatment arms, follow-up visits, primary endpoint, and safety monitoring. Use a timeline-based structure.”
Pathway Diagram Prompt
“Create a pathway diagram for inflammatory signaling in autoimmune disease. Include cytokine release, immune cell activation, inflammatory cascade, tissue damage, and therapeutic intervention points.”
Visual Summary Prompt
“Generate a visual summary comparing three drug mechanisms of action in the same disease area. Include target, pathway, expected biological effect, and key differences. Use a clean comparison table format.”
Medical Illustration Prompt
“Create a medical illustration concept showing disease progression from healthy tissue to inflamed tissue and damaged tissue. Include clear labels and avoid excessive decorative elements.”
Research Report Figure Prompt
“Create a figure concept summarizing a medical research report. Include research question, evidence sources, study comparison, key findings, evidence gaps, and final conclusion.”
Common Mistakes When Creating Scientific Figures
Adding Too Much Text
A figure should not become a paragraph with icons. Keep labels short and move detailed explanations into the caption or main text.
Starting Without a Clear Purpose
If the figure does not have one main message, readers will not know what to focus on.
Using Inconsistent Labels
Use the same terms throughout the figure. Avoid switching between abbreviations and full terms without explanation.
Weak Visual Hierarchy
If every element looks equally important, the reader cannot identify the main idea.
Decorative Visuals Without Scientific Meaning
Avoid adding icons, gradients, or illustrations that do not support the research message.
Not Checking Scientific Accuracy
AI-generated drafts and template-based visuals should always be reviewed by researchers.
Ignoring Journal or Conference Requirements
A visually attractive figure may still fail if it does not meet resolution, size, color, or file-type requirements.
When Should Researchers Use AI for Scientific Figures?
AI can be useful when the researcher needs to move quickly from concept to draft.
Good use cases include:
- Early figure planning
- Mechanism explanation
- Experimental workflow drafting
- Grant proposal visuals
- Poster figure concepts
- Presentation visuals
- Research report summaries
- Graphical abstract planning
AI is especially helpful when the researcher knows the science but needs help structuring the visual.
However, human review is necessary for:
- Final publication submission
- Regulatory or clinical materials
- Complex data visualization
- Journal-specific formatting
- Figures based on sensitive clinical claims
- Any content requiring precise source traceability
For examples of biomedical research and evidence-based outputs, explore Noah AI Research Insights. To understand how domain-specific biomedical research workflows differ from general-purpose AI tools, read Noah vs ChatGPT.
Try Noah AI for Free Use Noah AI to search, compare, and analyze biomedical evidence with AI-powered research workflows.
Free credits are available, and no credit card is required to get started.
Final Takeaway
Creating effective figures for scientific publications requires more than design software. It requires a clear research message, accurate scientific content, logical structure, readable labels, and careful review.
Traditional tools such as Adobe Illustrator, PowerPoint, and BioRender remain useful, especially for final polishing. AI scientific figure makers can help researchers move faster in the planning and drafting stages.
Noah AI can support researchers by helping turn complex medical and life science ideas into structured figure concepts, mechanism diagrams, experimental workflow figures, graphical abstracts, and research report visuals. But final responsibility remains with the researcher. Scientific accuracy, source traceability, and journal requirements should always be reviewed before submission.
For medical and life science researchers who need a more structured figure planning workflow, Noah AI can help organize research questions, summarize evidence, and turn complex content into clearer visual concepts.
FAQ
What is a scientific figure maker?
A scientific figure maker is a tool that helps researchers create visuals for scientific communication, such as mechanism diagrams, experimental workflow figures, graphical abstracts, medical illustrations, and research figures for papers or presentations.
How do I create effective scientific figures for research publications?
Start with a clear figure purpose, choose the right figure type, list the necessary scientific elements, draft the layout, review scientific accuracy, refine labels and hierarchy, and adapt the final figure to journal or presentation requirements.
Is Adobe Illustrator useful for scientific figures?
Yes. Adobe Illustrator for scientific figures is still useful for precise editing, layout control, and final polishing. However, it requires design experience and may take more time than template-based or AI-assisted tools.
Can AI create publication-ready scientific figures?
AI can help with early planning, drafting, and figure concept generation, but researchers should not assume AI outputs are publication-ready without review. Scientific accuracy, labels, formatting, and source traceability must be checked by humans.
How can Noah AI help with scientific figure generation?
Noah AI can help researchers turn medical and life science content into figure concepts, organize mechanism diagrams, draft experimental workflow figures, plan graphical abstracts, and prepare research visuals for papers, posters, presentations, and reports.
What types of scientific figures can researchers create?
Researchers commonly create mechanism diagrams, pathway diagrams, experimental workflow figures, clinical study design figures, graphical abstracts, evidence summary figures, comparison tables, and medical illustrations.
Should researchers review AI-generated scientific figures?
Yes. Researchers should always review AI-generated scientific figure concepts for scientific accuracy, source traceability, terminology, and alignment with journal or conference requirements.