CLDN18.2 Drug Pipeline 2026: How to Track Assets, Biomarkers and Development Milestones with AI
Linda
A practical 2026 CLDN18.2 pipeline-intelligence tutorial covering asset mapping, biomarker strategies, development stages, zolbetuximab milestones, and modality comparison.
A practical pipeline-intelligence workflow for mapping CLDN18.2 assets, comparing biomarker strategies and modalities, and reconstructing the development history of zolbetuximab.
CLDN18.2 pipeline research is not just a list of drug names and phases. The field includes naked monoclonal antibodies, antibody–drug conjugates, CAR-T therapies, bispecific antibodies and other emerging approaches, each with different biomarker rules, safety considerations and development paths.
A useful workflow therefore connects target → modality → asset → biomarker strategy → development stage → current status → milestone history. That structure is more informative than a simple pipeline count because it preserves the clinical context behind each program.
1. Why CLDN18.2 Pipeline Research Requires More Than a Drug List
The central problem is comparability. Zolbetuximab, satri-cel, ADCs and bispecific antibodies all target CLDN18.2, but they do not test the same therapeutic hypothesis. Biomarker cutoffs can differ substantially, treatment settings are not interchangeable, and one asset’s approval does not validate every CLDN18.2 modality.
Key rule: highest historical phase is not the same as current active development status. Pipeline research should track the latest verified status at the asset, indication, trial and geography levels.
2. Step 1: Map the CLDN18.2 Drug Pipeline
Start with a representative set of decision-relevant assets rather than trying to produce an exhaustive total. The useful fields are not only company and phase, but also modality, biomarker strategy and whether the program is still active.
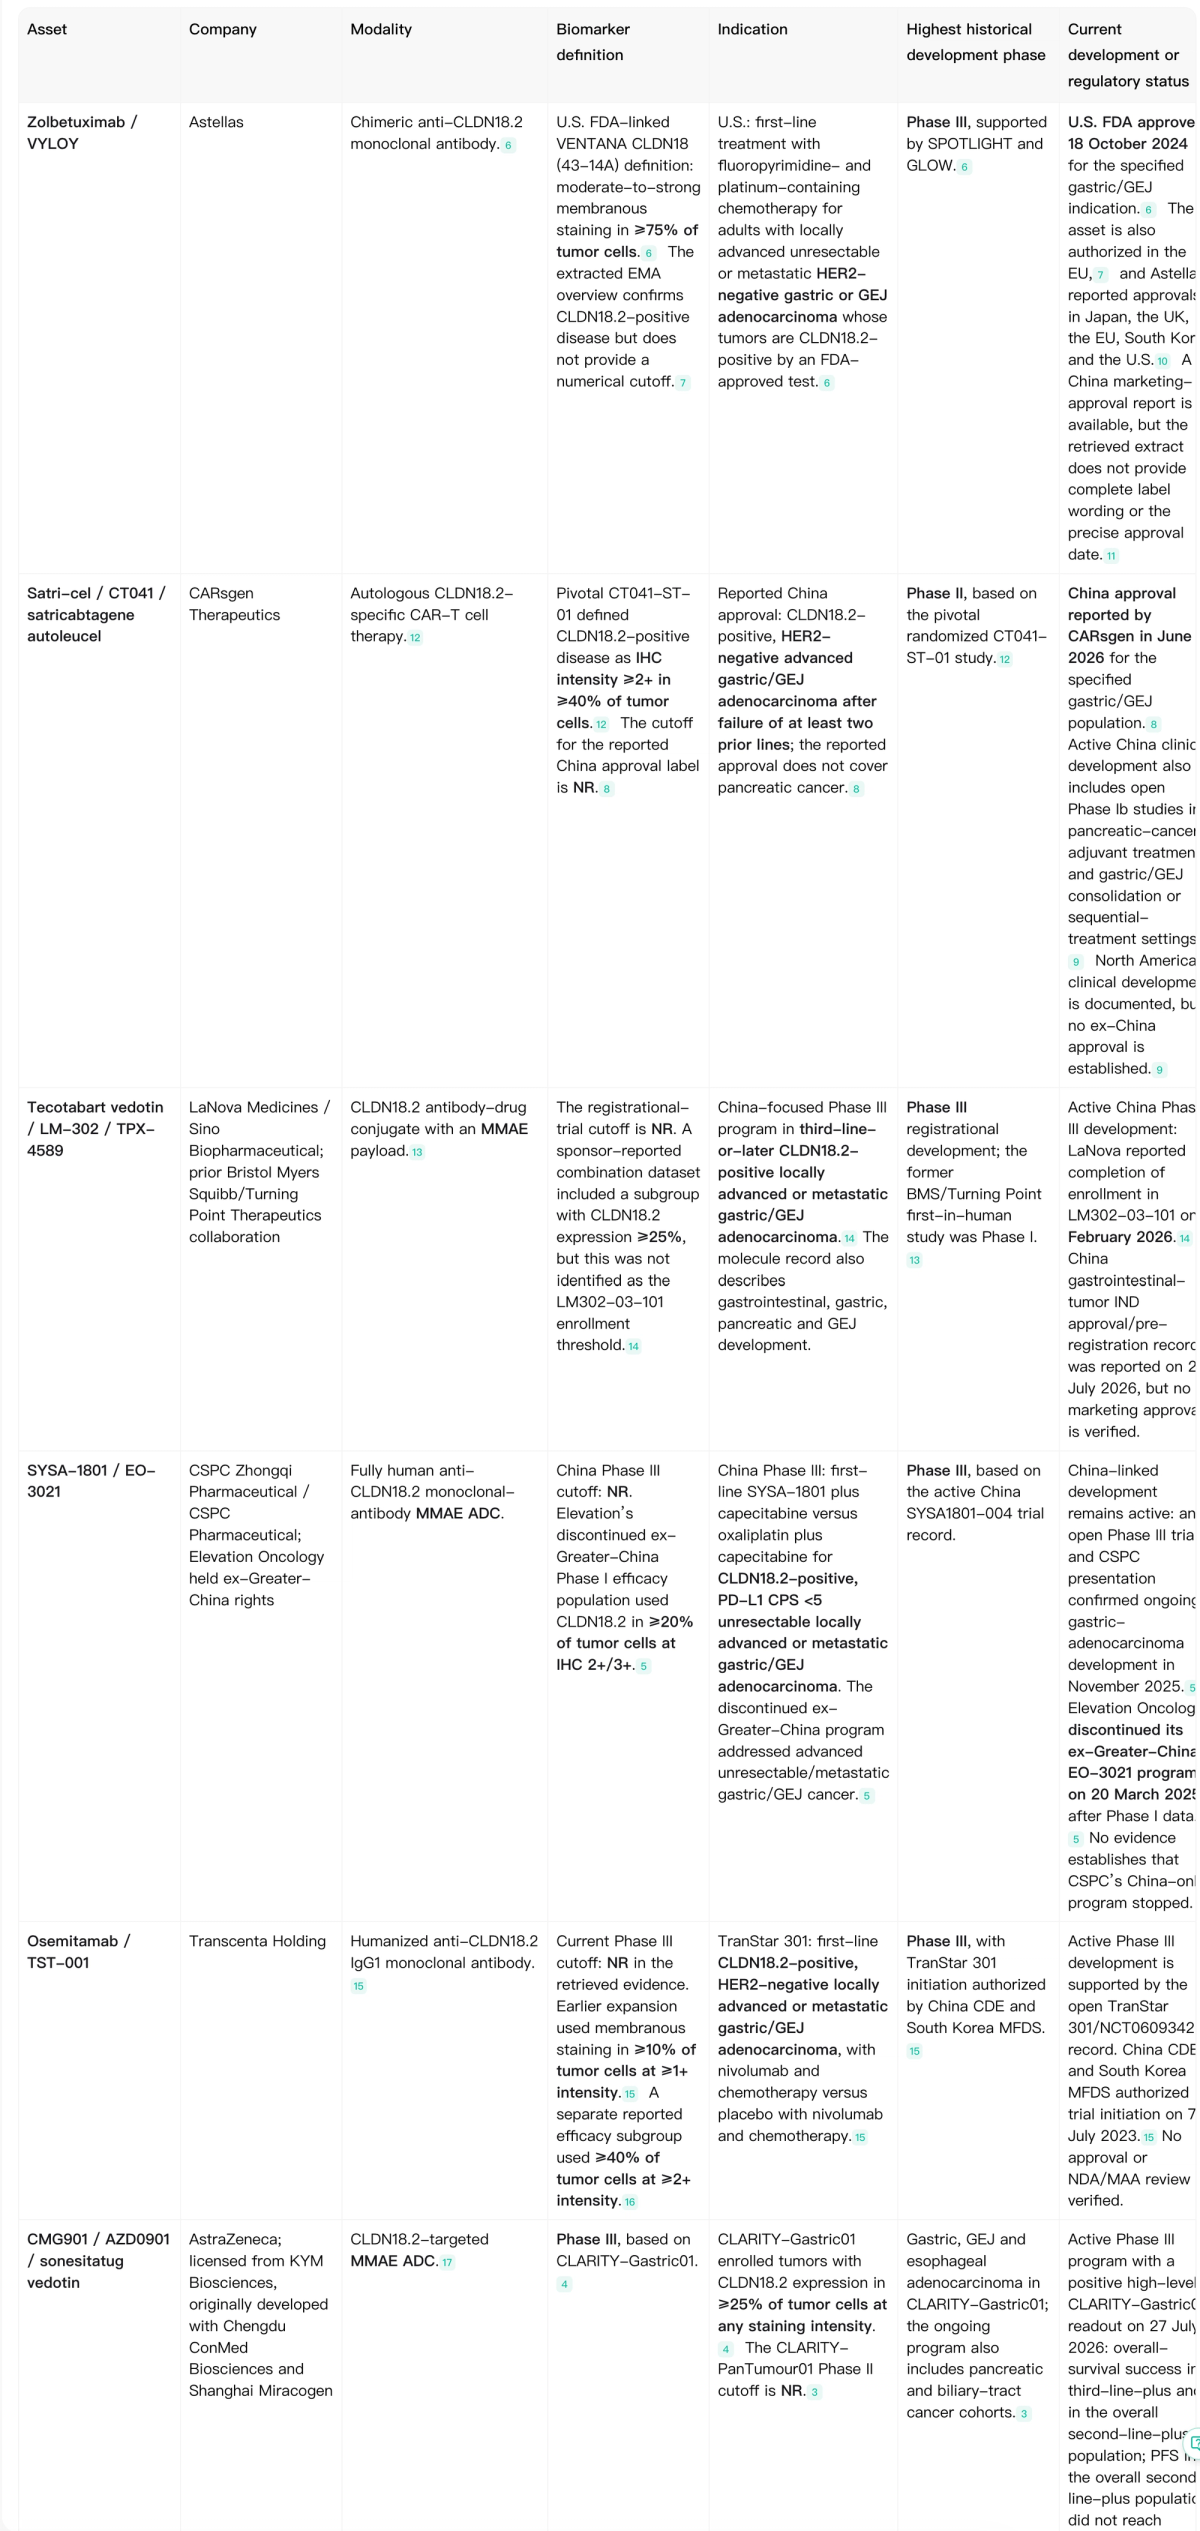
The map immediately shows why CLDN18.2 cannot be treated as one uniform pipeline. Zolbetuximab is an approved naked antibody with a strict biomarker definition and companion-diagnostic framework. Satri-cel represents a CAR-T strategy with a different expression threshold and operational burden. Tecotabart vedotin and SYSA-1801 represent ADC development, while osemitamab tests another antibody approach in Phase III.
The biomarker column is especially important. Differences in staining intensity, percentage of positive tumor cells and assay strategy can materially change the enrolled population. Cross-trial response rates should not be ranked without preserving those definitions.
3. Step 2: Identify the Most Decision-Relevant Assets
A practical shortlist should be organized by decision value rather than trial count.
Approved or clinically validated
Zolbetuximab is the reference asset because its program combines a defined biomarker threshold, randomized Phase III evidence and regulatory approval. Satricabtagene autoleucel (satri-cel) is a key cellular-therapy comparator because randomized Phase II evidence is available, although its treatment line, biomarker threshold and delivery model differ substantially.
Late-stage challengers
Tecotabart vedotin (LM-302), SYSA-1801 and osemitamab (TST-001) deserve close monitoring because they have late-stage development programs and test different ways of extending CLDN18.2 targeting beyond the approved zolbetuximab regimen.
Emerging modality bets
Earlier programs such as CMG901, IBI343, IBI389 and other engineered or multispecific approaches are better interpreted as modality experiments than as direct equivalents to approved first-line therapy. Their value lies in testing different payload, immune-engagement or biomarker hypotheses.
4. Step 3: Select One Representative Asset
Zolbetuximab is the strongest case study for a CLDN18.2 pipeline tutorial because it connects target biology, biomarker selection, randomized trials, regulatory review, companion-diagnostic use and ongoing post-approval development.
Its development also demonstrates a useful research principle: a program should be evaluated as a specific drug + regimen + biomarker + indication + geography, not as a generic statement that “CLDN18.2 works.”
Why SPOTLIGHT and GLOW matter
| Trial | Regimen | Key randomized result |
|---|---|---|
| SPOTLIGHT | Zolbetuximab + mFOLFOX6 vs placebo + mFOLFOX6 | Median PFS 10.61 vs 8.67 months; HR 0.75. OS HR 0.75. |
| GLOW | Zolbetuximab + CAPOX vs placebo + CAPOX | Median PFS 8.21 vs 6.80 months; HR 0.687. Median OS 14.39 vs 12.16 months; HR 0.771. |
5. Step 4: Build the Development Milestone Timeline
The most useful milestone timeline is not the longest one. It should preserve the events that changed the program’s clinical or regulatory meaning. For zolbetuximab, the 2024 sequence is especially instructive because it separates a regulatory execution setback from the later approvals that followed.
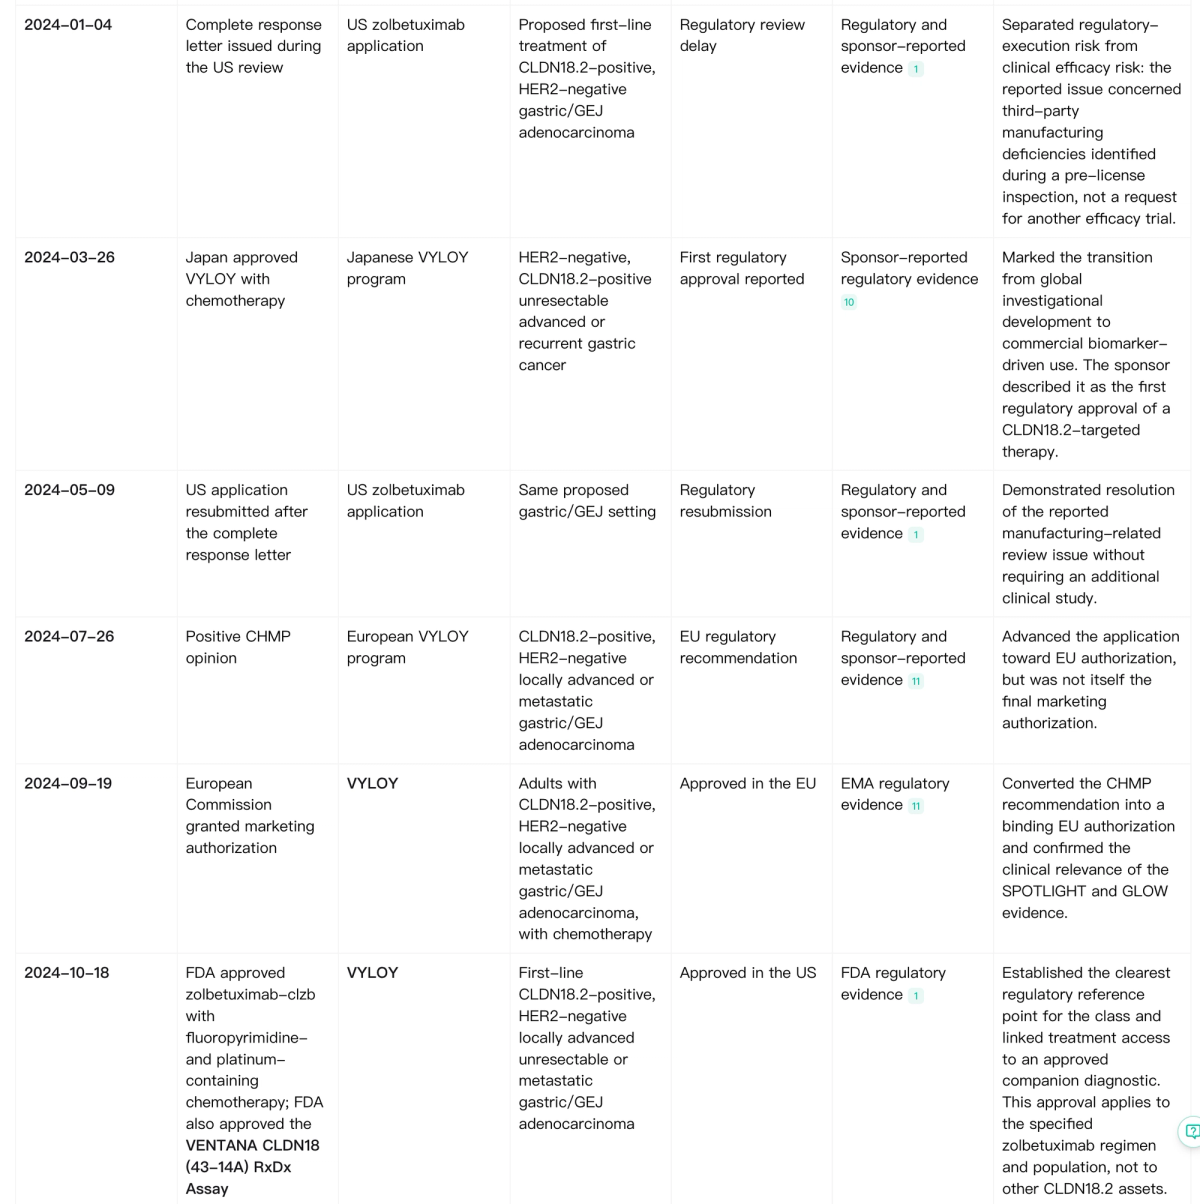
This sequence shows why milestone context matters. A complete response letter does not automatically mean clinical failure. In this case, the reported issue related to manufacturing review rather than a request for another efficacy trial. The subsequent resubmission, CHMP opinion, EU authorization and FDA approval tell a very different development story than a simple “delayed” label.
Map Drug Pipelines with Noah AI
Use Noah AI to map assets, biomarkers, modalities, development status, and clinical milestones across a drug pipeline.
Keep highest historical phase, current status, indication, geography, and evidence date separate so historical development records are not mistaken for current pipeline activity.
Free to use · Free credits included · No credit card required
Map Assets, Biomarkers, Modalities and Milestones with Noah AI →
6. Step 5: Interpret Development Status Correctly
A pipeline status is not one fact. It can refer to the asset, a specific indication, an individual trial, a regulatory decision or one geography.
| Status layer | What it means | Example |
|---|---|---|
| Asset-level highest phase | The most advanced stage reached across the asset’s history. | A Phase III program does not prove every study is open or successful. |
| Indication-level phase | The stage for a specific disease, treatment line or biomarker-defined setting. | Zolbetuximab can be approved in one setting while new combinations remain investigational. |
| Trial status | The operational state of one registered study. | Recruiting, completed, terminated or closed should not be collapsed into a molecule-level label. |
| Regulatory status | A regulator has authorized a defined product, population and regimen in a defined jurisdiction. | US approval does not imply approval in every geography. |
7. Step 6: Compare CLDN18.2 Modalities
The next layer of pipeline intelligence is modality comparison. These approaches should not be ranked as “best” or “worst”; they test different hypotheses and carry different development risks.
| Modality | Representative assets | Development maturity | Potential advantage | Main development challenge |
|---|---|---|---|---|
| Monoclonal antibodies | Zolbetuximab; FG-M108 | Approved reference plus early-stage programs | Established biomarker-regimen framework | Asset-specific efficacy; gastrointestinal toxicity and biomarker dependence |
| ADCs | CMG901; IBI343; LM-302 | Phase I to Phase III | Payload delivery may expand mechanistic options | Therapeutic window, hematologic/GI toxicity, antigen heterogeneity |
| CAR-T | Satri-cel | Randomized Phase II evidence | Active cellular expansion and persistence | Manufacturing, lymphodepletion, monitoring and CRS/cytopenia burden |
| Bispecifics | IBI389; SG-1906 | Early clinical | Direct T-cell or dual-pathway engagement | CRS, solid-tumor penetration and on-target/off-tumor risk |
8. Follow-Up Pipeline Questions
- Which CLDN18.2 assets have reached Phase II or later?
- Which programs have regulatory approval, and in which geographies?
- Which assets use different CLDN18.2 biomarker thresholds?
- Which programs are expanding beyond gastric or GEJ cancer?
- Which modalities have randomized evidence rather than only single-arm response data?
- Which late-stage assets could materially change competitive positioning?
- Which programs were discontinued, and what is publicly known about why?
- Which milestones occurred in the last two years?
9. What This Workflow Gives Researchers
The final workflow is:
CLDN18.2 → modality map → asset filtering → representative asset → milestone timeline → current status → modality comparison → next research question.
This structure is more useful than a drug list because each asset remains tied to its indication, biomarker definition, evidence type, development status and strategic meaning. It also preserves uncertainty instead of silently upgrading a sponsor announcement, trial registry entry or historical phase into a stronger claim.
For more on Noah’s research workflow, see Noah AI research workflows.
Try Noah AI for Free
Use Noah AI to search, compare, and analyze biomedical evidence with AI-powered research workflows. Free credits are available, and no credit card is required to get started.