
Best AI Graphical Abstract Makers for Research Papers (2026)
Linda
Compare the best AI graphical abstract makers for research papers in 2026, including Noah AI, BioRender, Mind the Graph, and Canva, with a real DAPA-CKD example.
A graphical abstract turns a research paper into a compact visual summary of the study design, key findings, and main take-home message.
AI tools can now help researchers create the first draft faster, but they solve different parts of the task. Some are better at turning paper context into an initial visual structure, while others are better at editable scientific illustration, templates, or communication-focused layouts.
In this guide, we compare Noah AI, BioRender, Mind the Graph, and Canva specifically for creating graphical abstracts from research papers.
What Should a Good Graphical Abstract Show?
The study population. Readers should immediately understand who was studied.
The intervention or comparison. The treatment and control relationship should be visually clear.
The primary outcome. The key endpoint or result direction should be easy to identify.
The take-home message. The figure should make the main conclusion obvious without forcing the reader to reconstruct the paper.
These are also useful criteria for comparing tools: can the platform help researchers organize the paper into a clear visual story, preserve the important study context, and produce a draft that is practical to refine?
Quick Answer
Noah AI is most useful when you need to turn a biomedical paper or study context into a structured graphical abstract first draft.
BioRender is better suited to researchers who want AI-assisted generation with more direct control over editing and visual refinement.
Mind the Graph is useful for template-based graphical abstracts and science communication.
Canva is better suited to general presentation and communication layouts than research-specific graphical abstract creation.
The right choice depends on whether your main problem is building the first visual structure, refining a scientific figure, or designing a communication-ready final layout.
Best AI Graphical Abstract Makers at a Glance
| Tool | Best for graphical abstract work | Less suitable when |
|---|---|---|
| Noah AI | Turning biomedical paper context into a structured first draft | Final visual polishing is the only need |
| BioRender | Generating and refining editable scientific figures | Research interpretation is still the main bottleneck |
| Mind the Graph | You need research-context synthesis first | You need research-context synthesis first |
| Canva | Broad-audience layouts and presentation visuals | You need biomedical-specific figure structure |
A Real Graphical Abstract Test With Noah AI
Noah AI was tested on the DAPA-CKD trial, a useful case because a graphical abstract needs to preserve more than a topic label. It needs to communicate who was studied, what was compared, and what the main outcome direction was.
The requested draft used a three-panel structure covering the study population, dapagliflozin versus placebo, major kidney and cardiovascular outcomes, and the main take-home message.
Research Context Before Figure Generation
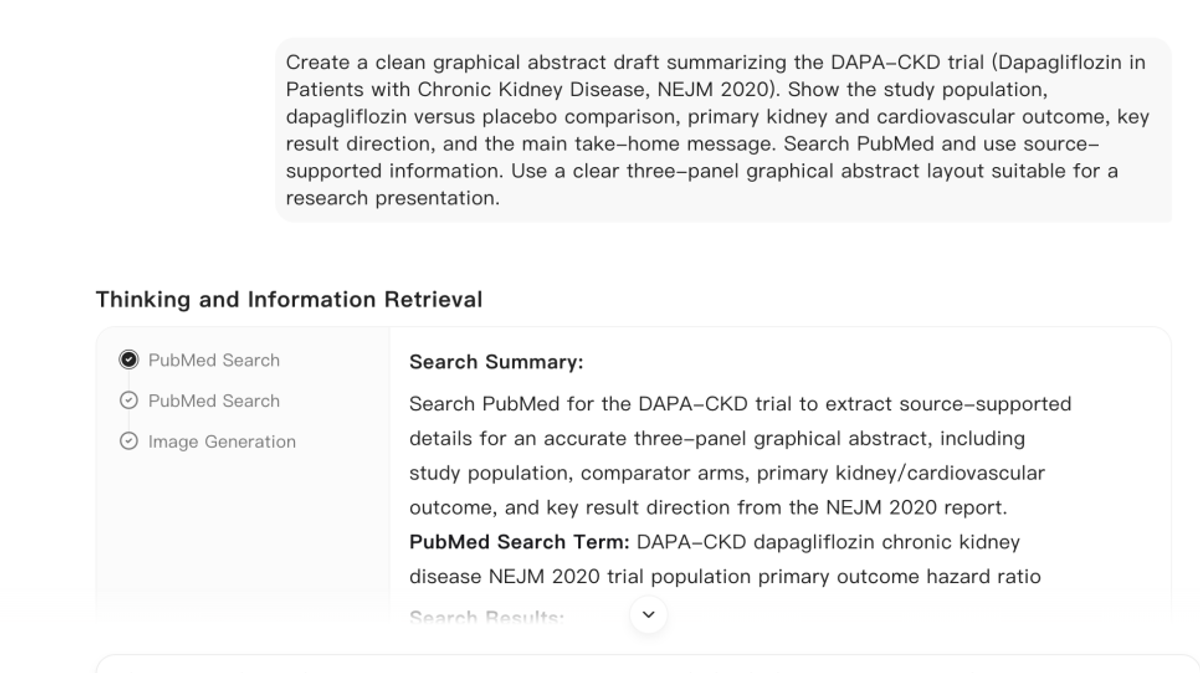
Figure 1. Noah AI retrieves PubMed context for the DAPA-CKD trial before generating the graphical abstract draft.
Before generating the figure, Noah retrieves study context through PubMed. In this example, the search focuses on the DAPA-CKD trial, including the population, comparator arms, kidney and cardiovascular outcomes, and result direction.
For graphical abstract drafting, this matters because the visual structure depends on the underlying study. A polished figure is not useful if the population, comparison, or endpoint has been simplified incorrectly.
Related reading: For broader figure-generation workflows, see The 10 Best Scientific Figure Creation Tools in 2026.
The Final Graphical Abstract Draft
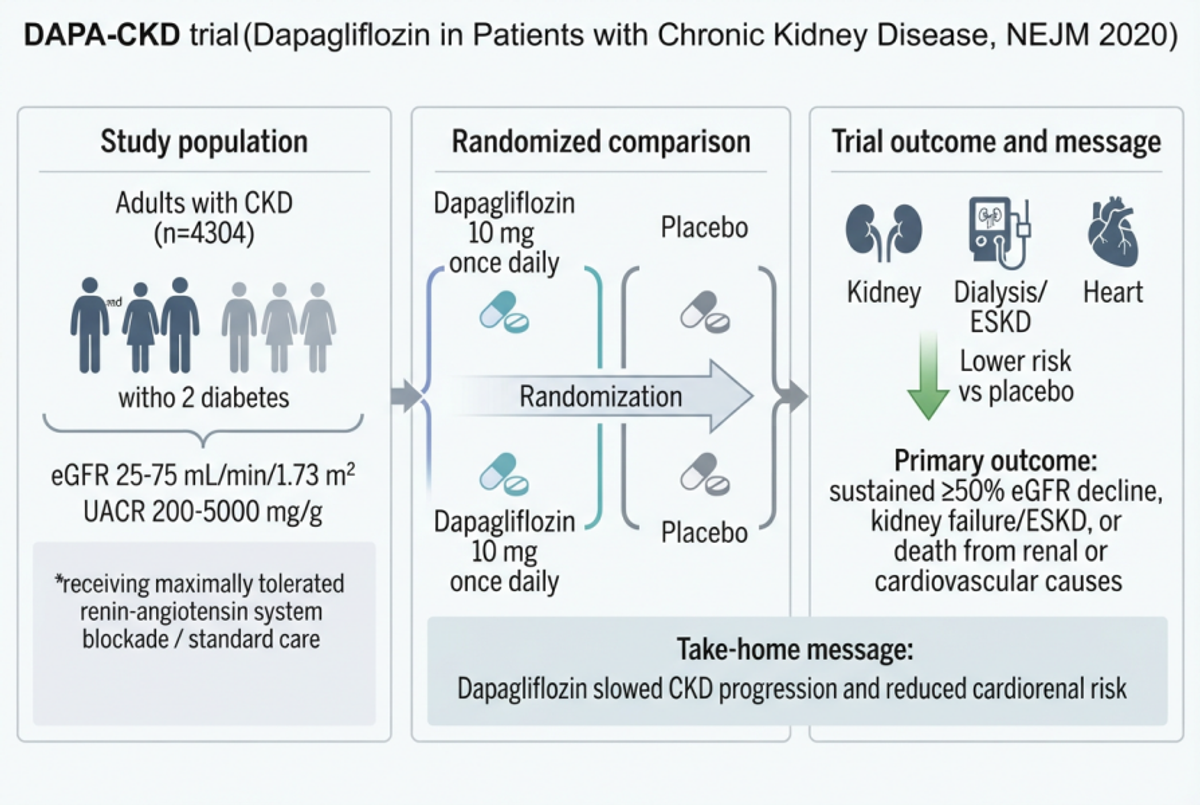
Figure 2. Noah AI graphical abstract draft summarizing the DAPA-CKD study population, randomized comparison, outcomes, and take-home message.
The final draft organizes the study into three clear sections: study population, randomized treatment comparison, and trial outcome/message. That structure makes the study easier to scan than a text-only summary because a reader can quickly identify who was studied, what was compared, and what the main outcome direction was.
The draft still requires researcher review. Text density, wording, numerical details, and visual balance may need refinement before the figure is used in a manuscript, conference presentation, or external scientific communication.
For this task, Noah's main value is therefore not simply image generation. It is turning biomedical research context into a structured visual starting point that the researcher can inspect and refine.
Related reading: For broader figure-generation workflows, see The 10 Best Scientific Figure Creation Tools in 2026.
Create a Graphical Abstract from Your Research with Noah AI
Turn biomedical paper context, PubMed evidence, uploaded files, or reference images into a structured graphical abstract draft.
Free to use · Free credits included · No credit card required
Create a Graphical Abstract with Noah AI →
How the Main Graphical Abstract Tools Differ
BioRender — Better for Editable Scientific Refinement
BioRender is a better fit when you already know what the graphical abstract should contain and want more control over the final visual. Its current AI figure tools can generate figures from text prompts and convert selected outputs into editable elements, allowing researchers to refine text, images, lines, arrows, shapes, alignment, and styling on the canvas.
Compared with Noah, the main difference is task emphasis: Noah is more useful when the challenge begins with biomedical research context, while BioRender becomes especially useful when detailed visual editing and refinement are the priority.
Related reading: Best Free BioRender Alternatives for Scientific Figures (2026).
Mind the Graph — Better for Template-Based Graphical Abstracts
Mind the Graph is useful when you want to build a graphical abstract from an existing visual structure or template. Its graphical abstract workflow provides ready-made templates, scientific illustrations, and drag-and-drop customization, which is practical when the scientific story is already clear and the main task is turning it into an accessible visual.
Compared with Noah, Mind the Graph is more template- and design-oriented, while Noah is more useful when the graphical abstract still needs to be derived from biomedical research context.
Canva — Better for General Communication Layouts
Canva can be useful when the graphical abstract is primarily a communication asset for slides, social media, internal presentations, or a broad audience. Its strength is flexible general-purpose design rather than biomedical research interpretation.
For a research-specific graphical abstract, researchers would typically need to define and verify the scientific structure themselves before using Canva for layout and presentation.
What Should You Review Before Using an AI-Generated Graphical Abstract?
Study structure. Check that the population, intervention, comparator, and study design match the source paper.
Outcome wording. Verify endpoint names, result direction, effect sizes, and time points against the original publication.
Visual emphasis. Make sure the figure does not visually overstate a secondary result or understate an important limitation.
Text density. A graphical abstract should simplify the paper without becoming another page of manuscript text.
AI can accelerate the first draft, but the researcher still owns the scientific accuracy and final communication choices.
Which Tool Should You Choose?
Choose Noah AI if your main challenge is turning a biomedical paper, uploaded file, literature context, or research question into the first graphical abstract structure.
Choose BioRender if the scientific structure is already defined and your priority is editable visual refinement.
Choose Mind the Graph if you want a template-driven graphical abstract with scientific illustrations.
Choose Canva if your priority is a general communication layout rather than a research-specific biomedical figure.
What is a graphical abstract?
A graphical abstract is a compact visual summary of a research paper or study. It typically highlights the study design, key comparison, major result, and take-home message so readers can understand the research more quickly.
Can AI create a graphical abstract from a research paper?
Yes. AI can help turn paper context or a structured research prompt into a first-draft graphical abstract. Researchers should still verify the scientific content, numerical details, labels, and layout before formal use.
How is a graphical abstract different from a mechanism diagram?
A graphical abstract summarizes a whole paper or study, while a mechanism diagram focuses on how a biological, molecular, or therapeutic process works.
Which AI tool is best for graphical abstracts?
It depends on the stage of the task. Noah AI is useful for generating a first draft from biomedical research context, BioRender for editable scientific refinement, Mind the Graph for template-based graphical abstracts, and Canva for general communication layouts.
Final Takeaway
The best graphical abstract tool depends on where you are in the figure-development process.
Noah AI is most useful when you need to move from biomedical paper context to a structured first draft. BioRender is better suited to detailed visual editing and refinement, while Mind the Graph is useful for template-based scientific communication. Canva fits broader presentation and communication needs.
For researchers starting with a paper rather than an existing visual, Noah's value is the ability to turn study context into a reviewable graphical abstract draft without starting from a blank canvas.
Create Your Next Graphical Abstract with Noah AI
Turn a biomedical research paper, study context, uploaded file, or reference image into a structured scientific figure draft with Noah AI.
Free to use · Free credits included · No credit card required
Create a Graphical Abstract with Noah AI →
Related Research Guides
- The 10 Best Scientific Figure Creation Tools in 2026
- Best Text-to-Figure AI Tools for Biomedical Research (2026)
- Best AI Tools for Creating Medical Mechanism Diagram Drafts (2026)
- Best Free BioRender Alternatives for Scientific Figures (2026)
- How to Create Effective Scientific Figures for Research Publications with Noah AI